
BUFKIT - Precipitation and Temperature Forecast
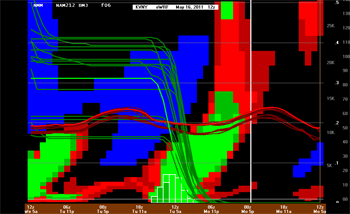
WRF Ensemble for VNY 05/16/11 12z
Overall it's been a wet water year in Southern California, but in the fashion of a Mediterranean climate the wet water year has been comprised of a patchwork of wet and dry months.
If it were not for an unusually stormy December in which Downtown Los Angeles recorded 8.32 inches more rain than normal, Los Angeles would be looking at about 76% of normal rainfall this water year instead of 131%. This reduced amount would be more typical of the rainfall recorded in Los Angeles during a La Nina influenced water year.
March was wet, but April and May have been dry. Sunday morning's wet weather added 0.07 inch to May's total for Los Angeles, but the combined April/May rainfall deficit is still about 0.9 inch.
BUFKIT analysis of WRF ensemble data for Van Nuys and LAX suggests tomorrow's storm is likely to produce between 0.1 inch and 0.3 inch of rain in the Los Angeles basin, and perhaps up to 0.4 inch in the San Fernando Valley. SREF Ensemble probabilities and HPC Probabilistic Precipitation Guidance support this estimate.
It won't take a lot of rain to break the record for May 17 at Downtown Los Angeles -- 0.18 inch would do it -- and it would also raise the water year rainfall total for Los Angeles to over 20 inches. The previous precipitation record for May 17 was 0.17", set in 1883. Note: Record for USC Campus (KCQT) is 0.06, set in 1949, but data from Civic Center is used for Downtown Los Angeles records prior to 1921.
There's a chance of more rain Wednesday, and then perhaps again Sunday into Monday. We'll see!
Update Tuesday, May 17, 2011. Rainfall amounts from the storm that affected Los Angeles last night and this morning were generally within the range projected by the WRF ensembles. Downtown Los Angeles (USC) recorded 0.15 inch for the storm, bring the water year total to 19.99 inches. Here's a report compiled by the NWS with some rainfall totals from around the area. Tonight's system is forecast to produce similar rainfall totals. At the moment some drizzle or light rain looks like a possibility in the Los Angeles area Sunday and early Monday.
Update Wednesday, May 18, 2011. Thanks to the system that moved into the area last night, Downtown Los Angeles (USC) recorded additional rainfall Tuesday evening, nudging the rainfall total for May 17 up to 0.18 inch, and breaking the old rainfall record for the date set in 1883. Shower activity appears to be winding down and partly cloudy skies are forecast for Los Angeles this afternoon. Rainfall totals from the second system were generally similar to Tuesday's amounts. Here's a report compiled by the NWS Los Angeles/Oxnard that lists the cumulative rainfall that has resulted from these two storms for a number of stations around the area. The water year total for Downtown Los Angeles (USC) now stands at 20.19 inches.
More information about Southern California weather and climate can be found using our WEATHER LINKS page.