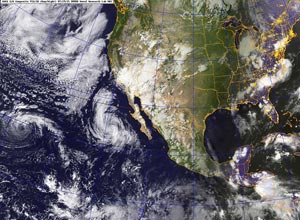
Page 1 of 2 in the MultivariateENSOIndexMEI category Next Page
# Tuesday, January 03, 2012

Following is a chart comparing the 2011-12 La Nina to other cold ENSO episodes that have occurred since 1949. With the exception of 1961-62, 2008-09 and perhaps 2011-12, the cold episodes are based on the Oceanic Niño Index (ONI) and are those specified in the CPC's tabulation of Cold & Warm Episodes by Season. A description of the parameters follows the chart. A GWO phase space plot is included for those cold episodes for which AAM data is available. Data for 2011-12 will be updated periodically.

Year Nov-Mar
AAM
Peak MEI4 Peak MEI Season Peak
ONI
Peak ONI Season L.A. Rain GWO
Phase Plot
1949-501,2 -- -1.423 APRMAY -1.7 DJF 9.94 --
1950-511 -- -1.261 NOVDEC -1.0 NDJ, DJF 8.21 --
1954-551 -- -1.578 MAYJUN (54) -1.2 ASO 11.94 --
1955-561 -- -2.276 MAYJUN (55) -2.0 OND 16.00 --
1956-571 -- -1.516 MAYJUN (56) -0.9 SON, OND 9.54 --
1961-623 -0.513 -1.081 DECJAN -0.6 ASO, SON 18.79 Click for Nov-Mar GWO Phase Space Plot
1962-63 -1.259 -0.849 JANFEB -0.7 OND, NDJ 8.38 Click for Nov-Mar GWO Phase Space Plot
1964-65 -1.145 -1.496 JULAUG -1.2 SON, OND 13.69 Click for Nov-Mar GWO Phase Space Plot
1967-68 -0.770 -1.060 APRMAY -0.9 JFM 16.58 Click for Nov-Mar GWO Phase Space Plot
1970-71 -0.976 -1.898 MARAPR -1.3 DJF, JFM 12.32 Click for Nov-Mar GWO Phase Space Plot
1971-72 -0.173 -1.463 AUGSEP -1.0 OND 7.17 Click for Nov-Mar GWO Phase Space Plot
1973-74 -1.331 -1.937 DECJAN -2.1 NDJ 14.92 Click for Nov-Mar GWO Phase Space Plot
1974-75 -0.842 -1.255 OCTNOV -0.9 OND 14.35 Click for Nov-Mar GWO Phase Space Plot
1975-76 -0.713 -2.000 SEPOCT -1.7 OND, NDJ 7.22 Click for Nov-Mar GWO Phase Space Plot
1984-85 -0.597 -0.743 APRMAY -1.1 NDJ 12.82 Click for Nov-Mar GWO Phase Space Plot
1988-89 -1.139 -1.591 AUGSEP -1.9 OND, NDJ 8.08 Click for Nov-Mar GWO Phase Space Plot
1995-96 -0.227 -0.641 DECJAN -0.7 OND to JFM 12.46 Click for Nov-Mar GWO Phase Space Plot
1998-99 -0.541 -1.219 JANFEB -1.4 NDJ, DJF 9.09 Click for Nov-Mar GWO Phase Space Plot
1999-00 -0.781 -1.228 JANFEB -1.6 NDJ, DJF 11.57 Click for Nov-Mar GWO Phase Space Plot
2000-01 -0.795 -.755 OCTNOV -0.7 NDJ 17.94 Click for Nov-Mar GWO Phase Space Plot
2007-08 -1.010 -1.619 FEBMAR -1.4 DJF, JFM 13.53 Click for Nov-Mar GWO Phase Space Plot
2008-093 -0.596 -.783 SEPOCT -0.8 DJF 9.08 Click for Nov-Mar GWO Phase Space Plot
2010-11 -0.596 -2.037 AUGSEP -1.4 SON, OND, NDJ 20.20 Click for Nov-Mar GWO Phase Space Plot
2011-125 -0.175 -0.980 OCTNOV -0.7 SON 3.76 Click for Nov-Mar GWO Phase Space Plot
1. AAM and AAM tendency anomaly data not available.
2. Based on ONI values beginning with DJF 1949-50.
3. ONI did not meet threshold of 5 consecutive overlapping seasons.
4. MEI values are normalized and may change as new data is added. Specified values were current as of December 31, 2011.
5. Data as of December 31, 2011. ONI may not meet threshold of 5 consecutive overlapping seasons for this episode.

Nov-Mar AAM: The mean of the global relative atmospheric angular momentum anomaly for the period November 1 to March 31 of the following year. Data is from the GWO phase space data file linked on the Global Synoptic Dynamic Model page of the PSD Map Room Climate Products. Reference Weickmann and Berry, 2008.

Peak MEI: The peak seasonal value of the Multivariate ENSO Index (MEI). Reference Wolter and Timlin, 1993, 1998. MEI values are normalized and may change as new data is added.

Peak MEI Season: The peak bi-monthly season(s) for which the MEI is computed.

Peak ONI: The peak Oceanic Niño Index (ONI) based on SST anomalies in the Niño 3.4 region. Reference Climate Prediction Center Cold & Warm Episodes by Season.

Peak ONI Season: The peak tri-monthly season(s) for which the ONI is computed.

L.A. Rain: The water year precipitation total in inches for Downtown Los Angeles (USC). Reference NWS Los Angeles/Oxnard Downtown Los Angeles Climate Page, 1921-2006 Calendar Year Rainfall.

GWO Phase Space Plot: Plot of global relative atmospheric angular momentum anomaly vs. global relative atmospheric angular momentum tendency anomaly for the period November 1 to March 31 of the following year. Data is from the GWO phase space data file linked on the Global Synoptic Dynamic Model page of the PSD Map Room Climate Products. Reference Weickmann and Berry, 2008.

Tuesday, January 03, 2012 7:46:46 AM (Pacific Standard Time, UTC-08:00)  #    Disclaimer  |   | 
# Wednesday, November 23, 2011

Click
GOES-11 Water Vapor Image
Sunday, November 20, 2011 - 11:30 am PST

For the past two years Los Angeles has recorded above normal rainfall over the first six months of the water year (Jul. 1 to Dec. 31). So far this year is following suit.

After a record-setting storm in early October in which Downtown Los Angeles (USC) recorded over an inch or rain, a series of upper level troughs have continued to bump up the rainfall total. The systems have tended to be amplifying upper level troughs that split, typically transforming the southern half of the trough into a difficult-to-forecast cut-off upper level low. The resulting cut-off lows have then tracked over, along, or off the Southern California coast producing varying amounts of rain.

Sunday's system was the fourth to produce measurable rain in Los Angeles this November. A strong cold front produced very heavy rain, resulting in flooded streets and highways and resulting in a host of other weather-related problems. In the middle of it all runners in the PCTR Santa Monica Mountains 9K, 18K, 30K and 50K were running distances up to 31.5 miles on the trails of Pt. Mugu State Park.

Downtown Los Angeles (USC) recorded 0.90 inches for the storm, bringing the water year total to 2.75 inches. This is 1.11 inch above the new 1981-2010 normal for rainfall from July 1 through November 22. Here are some additional (preliminary) precipitation totals from around the area, compiled by the NWS Los Angeles/Oxnard. More than an inch above normal sounds like a lot, but as of today only guarantees Los Angeles precipitation will be above normal through December 12.

Back on July 1 NOAA released the new 1981-2010 climate normals, replacing the 1971-2000 normals that have been used this past decade. Normals serve as a 30 year baseline average of climate variables such as monthly and annual maximum, minimum, and mean temperature; and monthly and annual total precipitation. For example, Downtown Los Angeles' new normal annual precipitation total is now 14.93 inches, down from the 15.14 inches we've been using.

After dropping to -0.503 for July/August, and then to -0.772 for August/September, the September/October value of the Multivariate ENSO Index (MEI) has dropped a bit more to -.968 sigma. This is well within La Nina territory, but almost one sigma less than last year's September/October value. Plots of the Global Wind Oscillation (GWO) for July 1 to November 19, 2011 and the same period last year illustrate the year-to-year difference in the atmosphere's response to La Nina conditions. So far, this year's response is consistent with a more active MJO and a shift toward a more neutral ENSO state.

While there's still a chance of rain in Southern California Thanksgiving Day, the forecast is looking better than it did a few days ago when rain was considered likely. The difficulty in the forecast is yet another upper level trough splitting into a cut-off upper level low. The 12z NAM forecasts the low to remain offshore on Thanksgiving Day, and move into Northern Baja by the late afternoon. The 09z SREF puts the probability of more than 0.01 inch of rain in coastal Southern California for the 12 hours ending 4:00 pm Thursday at 10% - 30% and the chance of more than 0.10 inch of rain at around 10%. A shift in the track of the low toward the coast would significantly increase the chance of rain. We'll see!

More information about Southern California weather and climate can be found using our WEATHER LINKS page.

Wednesday, November 23, 2011 8:47:53 AM (Pacific Standard Time, UTC-08:00)  #    Disclaimer  |   | 
# Saturday, October 08, 2011

Click
GOES-11 Water Vapor Image
Wednesday, October 5, 2011 - 11:30 am PDT

An unseasonably deep upper level low, unusually strong 170+ kt Pacific jet, and associated cold front combined to produce record-setting rainfall in Southern California Wednesday, October 5. Rainfall totals exceeded 1.0 inch in many areas.

Downtown Los Angeles (USC) recorded 1.15 inches, setting a new record for the date, and kick-starting the area's rainy season to 0.78 inch above normal. Rainfall records for the date were also set for LAX, Long Beach, Camarillo, Santa Barbara and several other locations. It was the first measurable rainfall at Los Angeles since June 17. Here are some preliminary precipitation totals from the NWS Los Angeles/Oxnard,NWS San Joaquin Valley/Hanford and NWS San Diego.

Enhanced convection in the Western Pacific associated with active phase of the MJO, and an extension of the North Pacific Jet caused by a positive East Asian mountain torque event appeared to have contributed to the unseasonable amount of rainfall. As observed by Ed Berry (Atmospheric Insights, Dec. 30, 2007), "...the MJO itself does not generate enough extratropical westerly wind flow to allow the East Asian jet to impact the USA west coast. A strong positive East Asian mountain torque needs to be involved, on average."

The increase in relative AAM shown by the GWO not withstanding, La Nina conditions appear to be consolidating in the equatorial Pacific. This four month sequence of Pacific Ocean Equatorial Temperature anomaly cross sections shows substantial subsurface cooling from July 11 to September 11. The Multivariate ENSO Index (MEI) has dropped from -0.5 for July/August to -0.8 for the August/September season. This drops the MEI from a rank of 16th last month to 13th this month, just above the quintile definition of a moderate La Niña ranking. Last year the MEI for August/September ranked 1st in the record since 1950. This TAO time-longitude plot of SST and SST anomaly shows less cooling than last year on this date.

To get an idea of what the impact of a second year La Nina might be on 2011-12 Winter precipitation in the continental U.S., the ESRL/PSD US Climate Division Dataset Mapping Page was used to construct a map of US composite precipitation anomalies for November to March for year two La Ninas since 1949. The years included were based primarily on MEI rankings, and include 1950-51, 1955-56, 1962-63, 1971-72, 1974-75, 1999-2000 and 2008-09. The base period was 1971-2000.

For this selection of years the coastal Southern California climate division recorded about 5 to 6 inches less precipitation than normal for the period November through March. The percent of normal water year rainfall recorded at Downtown Los Angeles (USC) ranged from a low of 47% (1971, 7.17"), to a high of 106% (1955, 16.00"). The average rainfall at Los Angeles for these years was 70.5% of normal, or 10.7".

More information about Southern California weather and climate can be found using our WEATHER LINKS page.

Saturday, October 08, 2011 2:05:22 PM (Pacific Daylight Time, UTC-07:00)  #    Disclaimer  |   | 
# Monday, September 12, 2011

Click
GOES-11 Water Vapor Image
Saturday September 10, 2011 - 6:30 pm PDT

A dynamic cutoff upper low centered over Southern California produced numerous thunderstorms in Southern California and a broad area of the southwestern U.S. Saturday. The thunderstorms produced thousands of lightning strikes, some heavy downpours, hail and strong winds.

According to an article on Yuba.net over 15,000 lightning strikes were recorded in California over the 24 hour period ending 0600 PDT Sunday. This plot of lightning detections was produced by Tahoe National Forest. (Typically lightning detections include both cloud-cloud and cloud-ground strokes.)

Thunderstorms were widespread in Southern California and several strong thunderstorms were reported by the NWS. This NWS NEXRAD image from about noon on Saturday shows several strong cells including one area flagged as severe. This composite image from WSI/Intellicast.com at 2:45 pm PDT shows estimated cloud tops, cell movement and hail. Half inch hail was reported in several locations by NWS spotters and there was one report of 1.25 inch hail near Lake Los Angeles. A wide swath of enhanced thunderstorm activity developed in the afternoon to the north and northeast of Los Angeles.

Some of the higher rainfall totals reported by the NWS include Lake Palmdale at 0.98 inch; Palmdale 0.84 inch and Lockwood Valley 0.58 inch. Downtown Los Angeles recorded a trace. Here's a NWS Los Angeles/Oxnard tabulation of some rainfall totals from around the area. Here also is a NWS San Joaquin Valley/Hanford tabulation of some rainfall totals in the southern San Joaquin Valley and Sierra.

In a Southern California Weathernotes post in February I commented that the tough question regarding La Niña was whether warming would continue into the NH summer, with neutral ENSO conditions prevailing as we move into autumn; or if the ENSO cycle would swing back toward a La Nina state. It was noted that since 1949, about half of the first year La Nina episodes have continued into a second or third year.

Climate scientist and Multivariate ENSO Index (MEI) codeveloper Klaus Wolter first mentioned the roughly 50/50 chance that La Nina would return following a summer respite in September 2010. A glance at a plot of the extended MEI index, going back to 1871 clearly shows a propensity for a return of La Nina in the year (or years) following stronger La Nina episodes.

In a September 8, 2011 press release NOAA reported that La Nina is back. More precisely, in their September 8 ENSO Diagnostic Discussion CPC states "La Niña conditions have returned and are expected to gradually strengthen and continue into the Northern Hemisphere winter 2011-12." The Multivariate ENSO Index (MEI) has dropped below the weak La Nina threshold, and several oceanic and atmospheric factors are indicative of a reemerging La Nina. There's still a (historically) slight chance of a return to ENSO neutral conditions this fall, but it doesn't appear likely. We'll see!

More information about Southern California weather and climate can be found using our WEATHER LINKS page.

Monday, September 12, 2011 1:39:58 PM (Pacific Daylight Time, UTC-07:00)  #    Disclaimer  |   | 
# Sunday, January 09, 2011

Following is a chart comparing the 2010-11 La Nina to 22 other cold ENSO episodes that have occurred since 1949. With the exception of 1961-62 and 2008-09, the cold episodes are based on the Oceanic Niño Index (ONI) and are those specified in the CPC's tabulation of Cold & Warm Episodes by Season. A description of the parameters follows the chart. A GWO phase space plot is included for those cold episodes for which AAM data is available.

Year Nov-Mar
AAM
Peak MEI4 Peak MEI Season Peak
ONI
Peak ONI Season L.A. Rain GWO
Phase Plot
1949-501,2 -- -1.423 APRMAY -1.7 DJF 9.94 --
1950-511 -- -1.261 NOVDEC -1.0 NDJ, DJF 8.21 --
1954-551 -- -1.578 MAYJUN (54) -1.2 ASO 11.94 --
1955-561 -- -2.276 MAYJUN (55) -2.0 OND 16.00 --
1956-571 -- -1.516 MAYJUN (56) -0.9 SON, OND 9.54 --
1961-623 -0.511 -1.081 DECJAN -0.6 ASO, SON 18.79 Click for Nov-Mar GWO Phase Space Plot
1962-63 -1.254 -0.849 JANFEB -0.7 OND, NDJ 8.38 Click for Nov-Mar GWO Phase Space Plot
1964-65 -1.141 -1.496 JULAUG -1.2 SON, OND 13.69 Click for Nov-Mar GWO Phase Space Plot
1967-68 -0.767 -1.060 APRMAY -0.9 JFM 16.58 Click for Nov-Mar GWO Phase Space Plot
1970-71 -0.973 -1.898 MARAPR -1.3 DJF, JFM 12.32 Click for Nov-Mar GWO Phase Space Plot
1971-72 -0.172 -1.463 AUGSEP -1.0 OND 7.17 Click for Nov-Mar GWO Phase Space Plot
1973-74 -1.326 -1.937 DECJAN -2.1 NDJ 14.92 Click for Nov-Mar GWO Phase Space Plot
1974-75 -0.839 -1.256 OCTNOV -0.9 OND 14.35 Click for Nov-Mar GWO Phase Space Plot
1975-76 -0.711 -2.000 SEPOCT -1.7 OND, NDJ 7.22 Click for Nov-Mar GWO Phase Space Plot
1984-85 -0.595 -0.743 APRMAY -1.1 NDJ 12.82 Click for Nov-Mar GWO Phase Space Plot
1988-89 -1.135 -1.591 AUGSEP -1.9 OND, NDJ 8.08 Click for Nov-Mar GWO Phase Space Plot
1995-96 -0.226 -0.641 DECJAN -0.7 OND to JFM 12.46 Click for Nov-Mar GWO Phase Space Plot
1998-99 -0.539 -1.219 JANFEB -1.4 NDJ, DJF 9.09 Click for Nov-Mar GWO Phase Space Plot
1999-00 -0.778 -1.228 JANFEB -1.6 NDJ, DJF 11.57 Click for Nov-Mar GWO Phase Space Plot
2000-01 -0.795 -.747 OCTNOV -0.7 NDJ 17.94 Click for Nov-Mar GWO Phase Space Plot
2007-08 -1.007 -1.619 FEBMAR -1.4 DJF, JFM 13.53 Click for Nov-Mar GWO Phase Space Plot
2008-093 -0.594 -.783 SEPOCT -0.8 DJF 9.08 Click for Nov-Mar GWO Phase Space Plot
2010-11 -0.595 -2.037 AUGSEP -1.4 SON, OND, NDJ 20.20 Click for Nov-Mar GWO Phase Space Plot
1. AAM and AAM tendency anomaly data not available.
2. Based on ONI values beginning with DJF 1949-50.
3. ONI did not meet threshold of 5 consecutive overlapping seasons.
4. MEI values are normalized and may change as new data is added. Specified values were current as of November 8, 2011.

Nov-Mar AAM: The mean of the global relative atmospheric angular momentum anomaly for the period November 1 to March 31 of the following year. Data is from the GWO phase space data file linked on the Global Synoptic Dynamic Model page of the PSD Map Room Climate Products. Reference Weickmann and Berry, 2008.

Peak MEI: The peak seasonal value of the Multivariate ENSO Index (MEI). Reference Wolter and Timlin, 1993, 1998. MEI values are normalized and may change as new data is added.

Peak MEI Season: The peak bi-monthly season(s) for which the MEI is computed.

Peak ONI: The peak Oceanic Niño Index (ONI) based on SST anomalies in the Niño 3.4 region. Reference Climate Prediction Center Cold & Warm Episodes by Season.

Peak ONI Season: The peak tri-monthly season(s) for which the ONI is computed.

L.A. Rain: The water year precipitation total in inches for Downtown Los Angeles (USC). Reference NWS Los Angeles/Oxnard Downtown Los Angeles Climate Page, 1921-2006 Calendar Year Rainfall.

GWO Phase Space Plot: Plot of global relative atmospheric angular momentum anomaly vs. global relative atmospheric angular momentum tendency anomaly for the period November 1 to March 31 of the following year. Data is from the GWO phase space data file linked on the Global Synoptic Dynamic Model page of the PSD Map Room Climate Products. Reference Weickmann and Berry, 2008.

Sunday, January 09, 2011 3:02:14 PM (Pacific Standard Time, UTC-08:00)  #    Disclaimer  |   | 
# Tuesday, November 09, 2010

AHPS Precipitation (Percent of Normal) for 30 Days Ending November 1. Click
AHPS Precipitation (Percent of Normal)
For 30 Days Ending November 1, 2010.

October was an unusually wet month in coastal Southern California. Many areas recorded more than an inch above normal rainfall, and some as much as 3 inches above normal. In a month where around 0.5 inch is considered normal, some areas received several times the normal amount of rainfall.

Most of October's rain resulted from two energetic upper lows, and a relatively strong trough/front that swept through the area October 30th. The front produced a new precipitation record for the date of 1.09 inches at Santa Barbara Airport Here's an archived NWS Public Information Statement with some rainfall totals for that storm.

Last week, an approaching Pacific trough pumped up a thick high pressure ridge over California, sending temperatures soaring and breaking temperature records across the area. November 3rd Long Beach Airport set a new high temperature record for the date of 100°F, and Downtown Los Angeles set a new record of 97°F. November 4th temps were once again in high 90s and several stations broke or tied high temperature records. Here are archived copies of the NWS Record Event reports for November 3 and November 4.

The southern part of the Pacific trough that produced our record high temps cut-off into a small upper low as it approached the coast, and moved onshore north of the Los Angeles basin on Saturday. The remainder of the trough and its associated front moved through the area Sunday evening into Monday. The front held together a little better than expected, and rainfall totals in the Los Angeles basin and valleys generally ranged from about 0.10 inch to 0.30 inch. Here's an archived NWS Public Information Statement with some rainfall totals from around the area..

The latest round of rainfall leaves many areas of Southern California way ahead on rainfall totals for the water year. Downtown Los Angeles (USC) missed out on a couple of the systems, and as of close of business yesterday has recorded 1.10 inch for the water year, which is only 0.06 inch above normal. By comparison, Los Angeles Airport is 0.85 inch above normal, and Camarillo/Oxnard is 0.97 inch above normal. This headstart on the rain season should help keep our rainfall totals a little closer to normal as our La Nina influenced rain season continues.

Speaking of La Nina, the September/October value of the Multivariate ENSO Index (MEI) increased slightly by 0.079 sigma, ending the record plunge from El Nino conditions earlier this year. In the past 30 days there was some decrease in the magnitude of negative SST anomalies in the east-central equatorial Pacific, but subsurface temperatures remain quite cool. Computer models are split on whether Nino 3.4 SST anomalies will continue to decline in magnitude during the Northern Hemisphere winter, but nearly all models indicate decreasing anomalies in early 2011. We'll see!

More information concerning Southern California weather can be found using our WEATHER LINKS page.

Tuesday, November 09, 2010 10:21:12 AM (Pacific Standard Time, UTC-08:00)  #    Disclaimer  |   | 
# Saturday, October 23, 2010

RAMDIS GOES-11 Water Vapor Image October 19, 2010 at 2:30 p.m. Click
RAMDIS GOES-11 Water Vapor Image
October 19, 2010 at 2:30 p.m.

Sunday evening through Wednesday afternoon, another energetic cutoff upper level low spun showers and thunderstorms into Southern California, increasing water year rainfall totals for many stations to near or above normal. Precipitation amounts varied widely, with some stations recording a few hundredths of an inch or less, and some as much as an inch or more. As was the case with the upper low at the end of September, this system produced a number of strong thunderstorms. A severe thunderstorm warning was issued as a result of a cluster of strong thunderstorms in the Antelope Valley Tuesday evening.

Downtown Los Angeles (USC) was one of those stations that didn't have its rain bucket in the right place. The station recorded only 0.08 inch from Sunday evening to Wednesday afternoon, bringing its water year rainfall total to 0.51 inch, which is about 0.16 below normal. Here is an archived Public Information Statement (PDF) from the NWS with some rainfall totals from around the area.

The Aug/Sep value of the Multivariate ENSO Index (MEI), released October 6, dropped another 0.18 sigma to -1.99. This is the lowest value of the MEI since Jul/Aug of 1955, and ranks the current La Nina as the strongest in the MEI record for the Aug/Sep season. Equatorial SST have continued to cool, and this plot of 5-day TAO/TRITON SST shows anomalies of -2.0°C or greater extending west to nearly the dateline.

Cooling of SSTs in the Central Pacific appears to have been enhanced by strong 850mb easterly winds associated with an MJO which propagated into the Western Pacific over the past 2 weeks and slowly diminished in amplitude. Divergence aloft associated with the MJO appears to have enhanced typhoon and tropical storm development in the Indian Ocean and Western Pacific. CIRA TPW loops show a lot of tropical moisture being injected into an extending Pacific jet. This could amplify rainfall amounts along the west coast of the U.S. the next few days.

There's been some drizzle and light rain in the Los Angeles area this morning. BUFKIT analysis of 12z NAM data for Van Nuys and LAX generates about 0.1 inch of rain late Sunday afternoon and evening. The bulk of the precipitation is forecast to occur in the northern two-thirds of California and into the Pacific Northwest. We'll see!

More information concerning Southern California weather can be found using our WEATHER LINKS page.


Saturday, October 23, 2010 10:26:24 AM (Pacific Daylight Time, UTC-07:00)  #    Disclaimer  |   | 
# Thursday, September 30, 2010


Composite Precipitation for Eight Moderate to Strong Transitional La Ninas
(Mouse Over Image is Composite Precipitation for 16 La Ninas)

Updated October 6, 2010. Replaced 1975 with 2007 in composite of climate division precipitation for eight transitional moderate to strong La Ninas, and other revisions.

Monday at 12:15 p.m. PDT the temperature at Downtown Los Angeles (USC) reached 113°F (45°C). This is the highest temperature recorded downtown since weather recordkeeping began in 1877. All-time and daily records were broken at several location. Here's an archived NWS Public Information Statement with a list of the records that were broken.

A moist south to southeasterly flow associated with a high over the Great Basin and an upper low off the coast resulted in some thundershowers (and rainbows) in the Los Angeles area yesterday, and there's a chance of more thundershowers today. According to the NWS zone forecasts, a chance of thunderstorms will continue in the mountains through Saturday evening. (See update below.)

Since the peak of last Winter's El Nino, there has been an unprecedented drop in the Multivariate ENSO Index (MEI). MEI bimonthly (e.g. Sep/Oct) seasonal ranks range from 1 to the total number of years for the season in the record, currently 60 or 61. A rank of 1 represents the strongest La Nina for the season, and a rank of 60 or 61 the strongest El Nino. Based on MEI seasonal ranks, in six months ENSO conditions switched from the fifth strongest El Nino for the Feb/Mar season to the second strongest La Nina for the Jul/Aug season. As Klaus Wolter pointed out in his September 3rd MEI discussion, the only stronger La Nina in the MEI record for the Jul/Aug season was in 1955, and the last time the MEI was lower in any season was 1975.

In all 11 cases since 1950 in which the MEI was -1.0 or less in the Jul/Aug season, La Nina conditions persisted through the Nov/Dec season. In all but two cases, 1950 and 1964, the MEI remained below -1.0 from the Jul/Aug season through the Nov/Dec season. Most ENSO assessments project that La Nina conditions will persist through at least the end of 2010.

As they say, past performance does not guarantee future results, but in the cases of well established La Ninas and El Ninos, historical composites can provide some insight into what is likely. CPC's ENSO Temperature & Precipitation Composites page now includes composites which incorporate recent precipitation trends. Frequency of occurrence maps are also included for each composite. These composites indicate coastal Southern California has been trending drier in the rain season during the past 15 years. The composite plus trend plot for Jan-Feb-Mar precipitation anomaly is particularly dry in coastal Southern California, indicating negative anomalies in excess of 3 inches, with a high frequency of occurrence.

To get an idea of how US precipitation anomalies might differ in a strong La Nina versus the more general La Nina case, the ESRL/PSD US Climate Division Dataset Mapping Page was used to construct maps of US composite precipitation anomalies. The two cases can be compared by moving the mouse cursor over the image. The initial image is a composite based on eight moderate to strong La Nina years which were preceded by El Nino or neutral conditions. The "mouse over" image is a composite of 16 cases* in which the MEI was in the lower 30%-tile of MEI ranks.

Another consideration in assessing potential ENSO impacts is the likelihood that a La Nina (or El Nino) will result in either extremely dry or extremely wet conditions. Here are maps showing the risk of precipitation extremes for the periods Nov-Dec-Jan, Dec-Jan-Feb and Jan-Feb-Mar during La Nina. These were generated using the ESRL/PSD page Risk of Seasonal Climate Extremes in the U.S. Related to ENSO. According to these maps, Southern California isn't likely to have an extremely dry 2010-2011 rain season, although CPC ENSO composites suggest there is at least some possibility of a dry rain season, particularly in the period Jan-Feb-Mar.

CPC's current operational precipitation outlook for Nov-Dec-Jan, issued September 16, 2010, shows roughly equal probabilities of above average, near average, or below average precipitation in the Coastal Southern California climate division. As the rain season progresses, these probabilities become more skewed toward below normal precipitation. In the period Jan-Feb-Mar the probability of below normal precipitation is calculated to be about 40%, while the chances of above normal drop to around 25%. The skew become slightly more pronounced in the period Feb-Mar-Apr.

All of this suggests below average precipitation in the Coastal Southern California climate division for the period November 2010 through March 2011. How much below average? Perhaps on the order of 3 to 6 inches. Over the 16 years used in the La Nina climate division composite, rainfall at Downtown Los Angeles (USC) has ranged from 7.17" (1971) to 16.00" (1955), with an average value of 10.95". This is about 72% of the normal 15.14". If only the lowest 8 MEI ranked (strongest La Nina) years are included, the average rainfall for Los Angeles works out to 11.08", or about 73% of normal.

Although it appears unlikely, average to above average seasonal rainfall could occur. Also, damaging storms with heavy or prolonged precipitation are still a possibility.

*The 16 years in the La Nina composite were taken from the 19 lowest MEI ranks for Sep/Oct. This includes 1950, 1954, 1955, 1956, 1961, 1962, 1964, 1967, 1970, 1971, 1973, 1974, 1975, 1988, 1995, 1998, 1999, 2007 and 2008. The marginal La Nina years of 1961, 1967 and 1995 were excluded in the 16 year set. An Oceanic Niño Index (ONI) based selection of cold episodes for SON would include 1984 and 2000, and exclude 1961, 1967 and 2008.

Update October 1, 2010. Intellicast.com composite radar shows some strong thunderstorms in Southern California this afternoon, with hail reported, and tops indicated at 35,000 to 40,000 ft. The moist subtropical flow is forecast to continue through Sunday, and along with it, a chance of showers and thunderstorms.

More information concerning Southern California weather can be found using our WEATHER LINKS page.

Thursday, September 30, 2010 2:33:23 PM (Pacific Daylight Time, UTC-07:00)  #    Disclaimer  |   | 
# Saturday, July 17, 2010

Click
TAO/TRITON SST & SST Anomaly
July 17, 2010

Following a 26 day stretch in which the temperature at Downtown Los Angeles was below normal 25 of the days, and several lowest maximum temperature records were set around the area, temperatures have soared, and record high temperatures for the date have been recorded at several locations.

On June 30, Downtown Los Angeles ended the water year about 8% above normal. Some stations in the Los Angeles area recorded more than this and some less. There was a wide range of values. For example, Long Beach Airport was about 20% above normal and Santa Barbara Airport about 23% above; but Camarillo Airport reported 31% below normal rainfall. Here's an AHPS graphic showing the percent of normal precipitation in California and the Southwest for the year ending July 1 at 12z.

Equatorial Pacific SSTs have generally continued to cool. According to the CPC's Weekly ENSO Update, issued July 12, the latest weekly SST departures were -1.3°C (Niño1+2), -1.0°C (Niño 3), -0.8°C (Niño 3.4), and -0.4°C (Niño 4). According to the CPC, La Niña conditions occur "when the monthly Niño3.4 OISST departures meet or exceed -0.5°C along with consistent atmospheric features. These anomalies must also be forecasted to persist for 3 consecutive months."

Reflecting the transition from El Nino to La Nina conditions, the Multivariate ENSO Index (MEI) for May-June experienced an unprecedented drop for the time of year, decreasing nearly 1 standard deviation to a value of -0.41. In addition, the Global Wind Oscillation (GWO) has orbited about -2 SD down on the La Nina side of the phase space plot, and with the atmosphere in a generally low momentum state, may be in that neighborhood for a while.

The most recent IRI ENSO Update, released July 15, projects "an approximately 80% probability for continuing La Niña conditions, and a 20% probability for returning neutral ENSO conditions. "

More information concerning Southern California weather can be found using our WEATHER LINKS page.


Saturday, July 17, 2010 7:53:54 PM (Pacific Daylight Time, UTC-07:00)  #    Disclaimer  |   | 
# Saturday, June 05, 2010

Click
Niño Region SST Anomalies

Woodland Hills (Pierce College) topped the 90° mark for the first time this year Memorial Day weekend, and after cooling a few degrees during the week, temperatures are back into the 90's this afternoon. A quick look at temps around the area shows temps near 70 on the coast; 80's to 90's in the valleys, and triple digits in the deserts.

Reflecting the transition to ENSO neutral conditions, the Multivariate ENSO Index (MEI) for April-May declined to 0.54. According to the CPC's Weekly ENSO Update, issued June 1, the latest weekly SST departures are -0.6°C (Niño1+2), -0.4°C (Niño 3), -0.2°C (Niño 3.4), and 0.4°C (Niño 4).

In his May 2010 MEI discussion Klaus Wolter projected the probability of a La Nina event emerging by the end of 2010 at roughly 50%. In it's May 2010 ENSO Quick Look, the International Research Institute for Climate and Society (IRI) put the probability of La Nina conditions from the August-October season through the remainder of 2010 at 42%. We'll see!

Downtown Los Angeles (USC) has recorded 16.36 inches of rain since the water year began July 1. This is more than an inch above the 1971-2000 annual climate norm of 15.14 inches. The water year ends June 30. Climatology and current forecasts suggest it is unlikely that this total will change by more than a hundredth or two before the end of the month.

More information concerning Southern California weather can be found using our WEATHER LINKS page.


Saturday, June 05, 2010 4:22:40 PM (Pacific Daylight Time, UTC-07:00)  #    Disclaimer  |   | 
# Friday, May 14, 2010

Click
TAO 5-Day Average SST and Anomaly
Period Ending May 14, 2010

During the last month the 2009-10 El Niño has essentially transitioned to ENSO neutral conditions. Over the course of the event, the Multivariate ENSO Index (MEI) peaked in JAN/FEB at 1.5, and the Oceanic Nino Index (ONI) peaked in NDJ at 1.8. The mean 5-day averaged November 1 to March 31 relative AAM anomaly was 0.304. The strongest El Niño forcing appeared to have occurred in late January after the active phase of the Madden-Julian Oscillation (MJO) enhanced El Nino convection in the equatorial Pacific. Here's a chart comparing the 2009-10 El Niño to 17 other warm ENSO episodes that have occurred since 1950.

Dynamical and statistical ENSO model forecasts suggest the possibility that equatorial Pacific SSTs will continue to decline, leading to weak to moderate La Niña conditions by late Summer or Fall. A return to El Niño conditions does not appear likely, but cannot be ruled out. In his May MEI discussion, Klaus Wolter points out that the 1957-1958 El Nino, an analog to the 2009-2010 El Niño, rebounded after dropping into neutral territory.

Downtown Los Angeles (USC) has recorded 16.31 inches of rain since the water year began July 1. This is more than an inch above the 1971-2000 annual climate norm of 15.14 inches. Recent runs of the GFS and ECMWF show a negatively tilted trough deepening and moving onshore early next week. At this point it looks like there's a pretty good chance of showers north of Pt. Conception, but only a slight chance down here. We'll see!

Update 05/18/10. Stations in the Los Angeles area generally recorded under a tenth of an inch from this system. Some isolated totals of about 0.25 inch were recorded in Ventura and Santa Barbara county, and Rocky Butte in San Luis Obispo recorded 0.48 inch. Here is an archived copy of a NWS Public Information Statement with some rainfall totals from around the area.

More information concerning Southern California weather can be found using our WEATHER LINKS page.


Friday, May 14, 2010 7:46:45 PM (Pacific Daylight Time, UTC-07:00)  #    Disclaimer  |   | 
# Monday, March 08, 2010

Click
GOES-11 IR Satellite Image
March 6, 2010 - 3:00 p.m. PST

As forecast, an energetic upper low skirted the Los Angeles area yesterday on its way south into northern Baja, Mexico. As the low moved south, a vorticity lobe spinning around the low arced into the Southern California coast, producing rain, thunderstorms, waterspouts, and blustery winds.

Rain amounts were variable, generally ranging from about 0.25 inch to 0.75 inch around the Los Angeles area. Indicative of the convective nature of the precipitation, Downtown Los Angeles (USC) recorded 0.42 inch, while a few miles away LAX recorded only 0.18 inch for the storm. The water year total for Downtown Los Angeles now stands at 14.66 inches -- only 0.48 inch less than the annual norm of 15.14 inches. Here is an archived copy of NWS Public Information Statement with some more rainfall amounts for this rain event.

Reflecting the enhancement of El Niño by the MJO at the end of January, the Multivariate ENSO Index (MEI) for January-February has increased to 1.5. As discussed by Klaus Wolter, MEI originator, this is the highest value of the Jan-Feb MEI since the strong El Niño of 1997-1998, and the fifth highest MEI value for Jan-Feb since 1950. This places the El Nino of 2009-10 in the top 10% of MEI rankings for the season since 1950, and above the "strong" El Niño threshold, as measured by the MEI. Here is a chart comparing the current El Niño to others since 1950.

The increase in the MEI corresponds to the increase in relative AAM since mid January and underscores the potential role of the Global Wind Oscillation (GWO) in assessing the response of the atmosphere to El Niño. It also reinforces the notion that the El Niño phenomena is more than just warm SSTs in the central equatorial Pacific. As we've seen several times in recent years, warm SST anomalies in the Niño 3.4 region alone are not sufficient for evaluating an El Niño and its potential impacts.

More information concerning Southern California weather can be found using our WEATHER LINKS page.


Monday, March 08, 2010 9:05:26 AM (Pacific Standard Time, UTC-08:00)  #    Disclaimer  |   |