Page 1 of 1 in the drought category
# Wednesday, 18 August 2021

WRCC/HPRCC Percent of Normal Precipitation, July 1, 2020 to June 30 2021 Click
WRCC/HPRCC Percent of Normal Precipitation
July 1, 2020 to June 30 2021

Downtown Los Angeles (USC) ended the 2020-21 rain year (July 1 to June 30) with 5.82 inches of rain. This is about 41% of the new normal annual precipitation total of 14.25 inches. Much of the West recorded below average precipitation for the rain year.

The amount of rainfall that is considered "normal" for Downtown Los Angeles has decreased nearly an inch in the past three decades. The normal rainfall for Los Angeles was 15.14 inches based on 1971-2000 climate data, and dropped to 14.93 inches based on data from1981-2010. Analysis of 1991-2020 data provided the new normal of 14.25 inches. Interim 2006-2020 climate data is shockingly dry, with normal rainfall in Los Angeles calculated at only 11.39 inches! For more info see U.S. Climate Normals and Normals Calculation Methodology 2020 (PDF).

La Nina conditions developed in August 2020 and transitioned to ENSO-neutral in April 2021. The Oceanic Nino Index (ONI) decreased to a minimum of -1.3 in the Oct-Nov-Dec season. The EL NIÑO/SOUTHERN OSCILLATION (ENSO) DIAGNOSTIC DISCUSSION issued August 12, 2021 projects a 70% chance of La Nina conditions being present during November-January.

Los Angeles rainfall during La Ninas has been variable, but skewed to the drier side. The average rain year precipitation for the 24 ERSST.v5 ONI-based Cold Episodes since 1949 is 11.84 inches. The highest amount was 20.20 inches in 2010-11 and the lowest 4.68 inches in 2017-18. In the past decade, rainfall totals for Los Angeles have been less in the second year of successive cold episodes, but this pattern doesn't hold up over the entire record.

More information about Southern California weather and climate can be found using our WEATHER LINKS page.

Wednesday, 18 August 2021 11:00:07 (Pacific Daylight Time, UTC-07:00)  #    Disclaimer  |   | 
# Friday, 31 August 2018

Color-coded Los Angeles (KCQT) Precipitation - July 1877 to June 2018
Color-coded Los Angeles (KCQT) Precipitation
July 1877 to June 2018

The graphic above is color-coded chart of Los Angeles (KCQT) rain year precipitation from 1877 to 2017, a period of 141 years. Years progress from left to right. The rain year is from July 1 of the indicated year to June 30 of the following year. Colors are indicative of the following amounts of rain:

Red: VERY DRY - less than 5 inches of rain.
Orange: DRY - more than 5 inches of rain, but less than 13 inches.
Light blue: ABOUT AVERAGE - more than 13 inches of rain, but less than 17 inches.
Blue: WET - more than 17 inches of rain, but less than 22 inches.
Dark Blue: VERY WET - more than 22 inches of rain.

Following are some observations regarding Los Angeles rainfall:

- VERY DRY and DRY years (orange & red) have been more common than VERY WET and WET years (blue & dark blue). In the first 70 years there were a few more dry years than wet years (30 vs. 25). In the last 70 years there have been about twice as many dry years as wet years (41 vs 20).

- Extended dry periods (orange & red) have been more common than extended wet periods (blue & dark blue) and generally last longer. The longest uninterrupted dry period is 7 years, while the longest wet period is only 3 years. If we allow for one interceding year, the longest dry period is 11 years and the longest wet period is 5 years.

- There were no VERY DRY years (red) prior to 1960 and three of the four VERY DRY years have occurred since 2001.

- ABOUT AVERAGE years (light blue) have not been common. Only 24 of 141 years (17%) have had ABOUT AVERAGE rainfall. The first 70 years had 15 ABOUT AVERAGE years and the last 70 years had 9 ABOUT AVERAGE years.

- Overall, VERY WET years (dark blue) have been more common than VERY DRY years (red), but in the last 30 years the number of VERY WET years (4) and VERY DRY years (3) have been about equal.

- Consecutive VERY WET (dark blue) or VERY DRY years (red) have been rare. There has been one instance of back-to-back VERY WET years (1956 & 1957) and no instances of back-to-back VERY DRY years.

Here is a PDF of the rainfall chart. The chart includes the January - December precipitation amounts for each year, as well as the rain year value.

More information about Southern California weather and climate can be found using our WEATHER LINKS page.

Friday, 31 August 2018 08:28:18 (Pacific Daylight Time, UTC-07:00)  #    Disclaimer  |   | 
# Monday, 02 July 2018

TAO/TRITON Five-Day SST - July 2016 to June 2018 Click
TAO/TRITON Five-Day SST
July 2016 to June 2018

Downtown Los Angeles (USC) has ended the 2017-18 rain year (July 1 to June 30) with only 4.79 inches of rain. That makes 2017-18 the third driest rain year since recordkeeping began in July 1877. The rainfall total was only 32% of normal and is less rain than was recorded during any rain year in our recent five year drought. The three driest rain years in Los Angeles have all occurred since 2001.

The June 2018 EL NIÑO/SOUTHERN OSCILLATION (ENSO) DIAGNOSTIC DISCUSSION says El Nino conditions are favored to develop during the Northern Hemisphere fall, and and this is the most likely ENSO state to be present this winter. According to the CPC/IRI consensus forecast there is a 50% chance of El Nino conditions developing this fall, with the probability increasing to about 65% this winter.

Keeping in mind last year's "failed" El Nino, the April-May value of the Multivariate ENSO Index (MEI) increased 0.9 SD to 0.47. This is just below the threshold of a weak El Niño ranking. Klaus Wolter's empirical analysis using historical analogues suggests that, compared to last month, the odds for the development of El Niño conditions later this year have dramatically increased.

If Los Angeles rain year precipitation is averaged for El Nino episodes (CPC ERSSTv5) since 1950, the average is about 120% of normal. However, El Nino conditions do not guarantee above average rainfall, particularly in the last 15 years or so. The driest rain year on record in Los Angeles (2006-07) was during an El Nino; and two rain years (2014-15 & 2015-16) of our recent five year drought were during an El Nino.

More information about Southern California weather and climate can be found using our WEATHER LINKS page.

Monday, 02 July 2018 10:58:36 (Pacific Daylight Time, UTC-07:00)  #    Disclaimer  |   | 
# Tuesday, 24 January 2017

California Percent of Normal Precipitation for July 1 to January 22, 2017 (WRCC) Click
California Percent of Normal Precipitation (WRCC)
July 1, 2016 to January 22, 2017

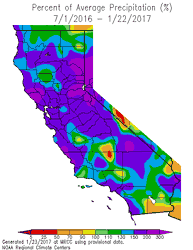
Update on February 2, 2017. Downtown Los Angeles has ended January 2017 with 8.38 inches of rain. This is 269% of the normal January rainfall total of 3.12 inches. The preliminary Rain Year precipitation total for Downtown Los Angeles for July 1 through January 31, 2017 is 14.33 inches, which is 193% of the normal amount of 7.44 inches. Here is an updated California Percent of Normal Precipitation map from the Western Regional Climate Center for July 1, 2016 to January 31, 2017.

On the heels of a wet December, a series of Pacific storms have resulted in the wettest start to the Rain Year (July 1 - June 30) and Water Year (October 1 to September 30) since the very wet year of 2004-2005.

The six day period from January 18-23 was particularly wet, with three storms producing a total of 5.53 inches of rain at Downtown Los Angeles (USC). Here are some preliminary 7-day precipitation totals from around the area from the Ventura County Watershed Protection District.

The last system of the series, which brought very heavy precipitation to the area on Sunday, was associated with a well-defined atmospheric river. Precipitation totals in the Los Angeles area for the storm generally ranged from about 2 to 5 inches. According to the NWS, new rainfall records for January 23 were set at Los Angeles Airport (2.94 inches), Camarillo (2.74 inches) and Long Beach Airport (3.97 inches). The rainfall at Long Beach Airport was the most ever recorded in a day at that location. Here are some precipitation totals from around the area compiled by the NWS Los Angeles/Oxnard and NWS San Diego.

As of yesterday Downtown Los Angeles (USC) has recorded 14.33 inches of rain for the Rain Year. This is 217% of the normal amount of 6.65 inches for the date, and 97% of the normal amount of rainfall for an entire year. Assuming we don't get any more rain this January, the 8.38 inches recorded will work out to 269% of the normal amount for the month.

The California Cooperative Snow Surveys Snow Water Equivalents report for today puts the snowpack for the date at an average 197% of normal. That's two times the normal amount.

A little precipitation has crept back into the GFS, GEFS and ECMWF forecasts for the Los Angeles area the first week of February. We'll see!

More information about Southern California weather and climate can be found using our WEATHER LINKS page.

Tuesday, 24 January 2017 19:10:12 (Pacific Standard Time, UTC-08:00)  #    Disclaimer  |   | 
# Tuesday, 27 December 2016

California Percent of Normal Precipitation for July 1 to December 26, 2016 (WRCC) Click
California Percent of Normal Precipitation (WRCC)
July 1, 2016 to December 26, 2016

As of today Downtown Los Angeles (USC) December rainfall is 1.75 inches above the monthly normal of 2.33 inches. Not since the beginning of the drought has Los Angeles experienced such a wet December. The 4.08 inches of rain recorded so far this month is the most since December 2010 and the most for any month since January 2010.

Since the Rain Year began July 1, 5.48 inches of rain has fallen at Downtown Los Angeles (USC). This is more than an inch above the normal July-December rainfall of 4.32 inches. It is the best start to the Rain Year (Jul 1-Jun 30) and Water Year (Oct 1-Sep 30) since 2010.

While the rain is good news, this graphic from the Western Regional Climate Center shows that the Jul-Dec precipitation in some areas of Southern California is still below normal.

Forecasting how the cut off upper level low currently spinning offshore southwest of Los Angeles and a developing upstream trough interact is a tough task, even for a supercomputer. The trough is expected to propel the low in our general direction and then replace/absorb it. Add to the mix the possibility of pulling up some sub-tropical moisture (or not) and the forecast becomes even trickier. Guess we'll see!

More information about Southern California weather and climate can be found using our WEATHER LINKS page.

Tuesday, 27 December 2016 15:50:30 (Pacific Standard Time, UTC-08:00)  #    Disclaimer  |   | 
# Saturday, 02 July 2016

Dying Redwoods Malibu Creek State Park Click
Dead and Dying Coast Redwoods Along Century Lake
Malibu Creek State Park

Downtown Los Angeles (USC) finished the 2015-16 rainfall year (July 1 to June 30) with 9.65 inches of recorded precipitation. This is about 65% of the 1981-2010 normal of 14.93 inches. This was the fifth consecutive year of below normal rainfall for Downtown Los Angeles, with a cumulative rainfall deficit of 35.86 inches --nearly three feet!

Observable impacts of the drought are widespread. Trees have been particularly hard hit. Dead trees can be seen along city streets, in parks, and throughout the open space areas and wildlands of Southern California. The dead and dying 100+ year old coast redwoods at Malibu Creek State Park are an example.

Most climate outlooks are forecasting La Nina conditions to develop over the Northern Hemisphere summer. Historically La Ninas have "on average" resulted in below normal precipitation in Southern California. But historical composites can be misleading. During the last five La Nina episodes (1999-00, 2000-01, 2007-08, 2010-11, 2011-12) Downtown Los Angeles (USC) has averaged 14.39 inches of rain, which is 96% of normal.

Even during one of three strongest El Ninos on record, precipitation outlooks based on historical composites and analogs didn't perform well in Southern California. Given the somewhat more variable rainfall in Southern California during La Ninas, to determine the winter precipitation outlook you might as well flip a three-sided coin.

More information about Southern California weather and climate can be found using our WEATHER LINKS page.

Saturday, 02 July 2016 13:39:23 (Pacific Daylight Time, UTC-07:00)  #    Disclaimer  |   |