# Monday, 21 March 2011

Click
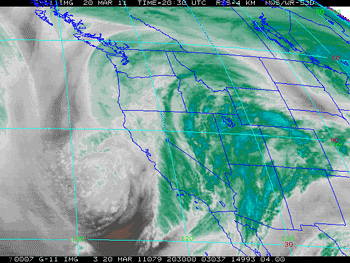
GOES-11 Water Vapor Satellite Image
Sunday, March 20, 2011 at 1:30 p.m.

Running in the rain and wind, and splashing through innumerable puddles, Markos Geneti set a new Los Angeles Marathon record in a time of 2:06:35. It was a remarkable performance, in adverse conditions. From 8:00 a.m. to 12:00 p.m. the Mt. Washington RAWS, near the start of the marathon, recorded 0.59 inches of rain; and the Beverly Hills RAWS near mile 17, recorded 1.27 inches. Periods of heavy rain were reported at Santa Monica Airport, near the finish line, through much of the race. According to a report in the Los Angeles Times sports blog, The Fabulous Forum, thousands of runners were evaluated for hypothermia and 25 runners were hospitalized.

Many rainfall records were set around the area Sunday, with some locations recording as much as one-third of a year's normal rainfall in 24 hours! In the early evening rainfall rates of over an inch an hour were recorded in Woodland Hills and Canoga Park. According to a NWS Storm Report, at 6:14 p.m. a flash flood was reported in Woodland Hills with "mud and debris flowing down the street" and "at least four to five vehicles stuck in flowing water."

Downtown Los Angeles (USC) recorded 2.42 inches of rain yesterday, breaking a record set in 1943. Santa Barbara Airport had its wettest day on record, recording 5.23 inches of rain. Here's an archived copy of the NWS Record Report for March 20, listing some of the rainfall records for the day.

Storm totals in excess of 3 inches have been common in Los Angeles, Ventura, Santa Barbara, and San Luis Obispo counties. Higher totals were recorded in many areas. As of 5:00 p.m. the NWS reported that Van Nuys had recorded 6.74 inches of rainfall, Northridge 6.08 inches, Newhall 7.20 inches, Santa Barbara Airport 6.27 inches, San Marcos Pass 10.72 inches, and Gibraltar Dam 11.73 inches. Here's an archived copy of a NWS report with some rainfall and snowfall amounts from around the area.

Downtown Los Angeles made up its rainfall deficit for the month of March and more, increasing its water year rainfall total to 18.55 inches, or about 123% of normal. This makes the 2010-2011 water year the wettest in Los Angeles during a La Nina over the last 60 years, surpassing the totals recorded during the strong La Ninas of 1955-56 (99% of normal) and 1973-74 (106% of normal), and weak La Ninas of 1967-68 (110%) and 2000-01 (118%).

Sunday's heavy rain appears to have had the earmarks of an atmospheric river event. NRL SSM/I IPW imagery (lower right) shows a pre-frontal band of IPW values of 35-40 kg/m2 impinging the coast, NEDIS blended TPW imagery showed a band of ~25 mm TPW extending some 4000 km to the longitude of Hawaii. A BUFKIT cross section based on 12z NAM data for VNY depicted a low level jet (LLJ) structure coinciding with the period of heaviest rainfall. Research by Dr. F. Martin Ralph, et. al., observed that in atmospheric rivers over the eastern Pacific, 75% of the water vapor transport below 500 mb takes place within the lowest 2.25 km and occurs with LLJ wind structure. In addition in cases where a LLJ is present, there was 50% greater precipitation efficiency.

More information about Southern California weather and climate can be found using our WEATHER LINKS page.

Monday, 21 March 2011 16:09:13 (Pacific Standard Time, UTC-08:00)  #    Disclaimer  |   | 
# Friday, 18 March 2011

Click
HPC 3-Day Precipitation Forecast
For the Period Ending 11:00 a.m. Monday, March 21

Along with January and February, March is one of the big three precipitation months in Southern California in which the average rainfall for Downtown Los Angeles exceeds 3.0 inches. In January we were about 2.5 inches below normal rainfall, and in February about 0.4 inch below normal. So far this March, we're nearly two inches below normal for the month. If it were not for an unusually wet December in which Los Angeles recorded 8.32 inches above normal rainfall, we'd be looking at 50% water year right now instead of over 100%.

If today's 12z NAM and GFS forecasts verify, we could make up that March deficit, and push our water year total up to nearly 120%! According to these numerical forecasts, we could see two to three inches of rain in the Los Angeles area by Monday afternoon, and significantly more in orographically favored foothill and mountain locations. The NAM forecasts moist southerly winds approaching 60 kts at the 5000 ft. level Sunday evening.

BUFKIT analysis of 12z NAM/GFS data generates 2.16/4.11 inches of rain for LAX, 3.56/3.57 inches for Van Nuys, and 4.01/4.20 inches for Santa Barbara. The GFS brings in the second front faster than the NAM, forecasting the onset of heavier rain during the day Sunday, rather than Sunday evening. The 09z SREF puts the probability of more than 1.0 inch of rain in the Los Angeles area for the 24 hour period ending Monday morning at about 90%.

And yes, it does look like there's a chance of rain for the Los Angeles Marathon. Although the heavies rain is forecast to hold off until Sunday afternoon or evening, the 09z SREF pegs the probability of 0.1 inch of rain or more in the Los Angeles area over the 6 hours ending at 11:00 a.m. Sunday at about 70%. BUFKIT analysis of 12z NAM data generates about 0.20 inch at LAX from 8:00 a.m. to noon, with temps in the mid 50's. The GFS says about 0.50 inch over the same period. We'll see!

Be sure to check the NWS Los Angeles/Oxnard web site for the latest forecasts, advisories and warnings. More information about Southern California weather and climate can be found using our WEATHER LINKS page.

Friday, 18 March 2011 11:41:41 (Pacific Standard Time, UTC-08:00)  #    Disclaimer  |   | 
# Thursday, 03 March 2011

Click
BUFKIT Bourgoiun Precipitation Type Analysis
For eWRF Ensembles for VNY at 8:00 am 02/26/11

The wetter ensemble member forecasts prevailed in last Friday's and Saturday's rain and snow event. Downtown Los Angeles recorded 1.20 inches for the storm. This brought the water year total to 15.78 inches, which is about 104% of normal. Although this might seem unusual in a La Nina influenced rain season, during two of the strongest La Ninas in the past 60 years -- 1955-56 and 1973-74 -- Los Angeles recorded 99% and 106% of normal rainfall. Here's an archived copy of a NWS tabulation of some rainfall totals from around the area from early Friday, February 25, to 10:00 p.m. Saturday, February 26.

The NAM and GFS, as well as the SREF and eWRF ensembles, had a tough time forecasting the rainfall produced by our current scenario -- a relatively shallow, moist westerly flow accompanied by modest jet stream dynamics. As this BUFKIT time-height cross section shows, the wettest eWRF ensemble member depicted a 125 kt jet max overhead, suggesting the models had some difficulty in forecasting the structure and strength of the jet. At best, the models forecast a few hundredths of an inch of rain in the Los Angeles area, but the most recent NWS tabulation of rainfall totals for the event lists many stations with between 0.1 and 0.25 inch. As of 4:00 a.m. this morning, Downtown Los Angeles has recorded 0.16 inches for the storm, bumping the water year total to 105% of normal.

As a result of the westerly flow, snow levels are currently high, but one of the interesting facets of last Friday's storm was the possibility of very low elevation snow. A NWS Winter Weather Advisory issued February 25 for the Santa Monica Mountains Recreation Area forecast the snow level to drop overnight from above 3000' to between 1000' and 1500'. Snow accumulations from 1 to 3 inches were expected. Some low elevation post frontal showers of graupel or snow were reported in the east San Fernando Valley and La Crescenta Saturday afternoon, but based on the conditions on Sandstone Peak (el. 3111'), the snow anticipated in the SMMRA did not occur. It was an especially challenging forecast, pitting pre-frontal warm air advection, against post-frontal cold air advection, falling humidity, and fluctuating regions of snow growth and omega.

Developed in part to help forecasters deal with lake effect snow, BUFKIT includes a number of special features for snow forecasting and visualization. For example, following are two time-height cross sections generated by BUFKIT from NAM data for VNY (Van Nuys) from 4:00 p.m. Friday, February 25. The elevation for the Bourgoiun precipitation type analysis for each cross section has been raised to 2711 feet MSL. The first BUFKIT cross section shows snow growth, omega, temperature, and the projected precipitation amount and type. The second cross section shows the same parameters, but with relative humidity instead of omega. The purple and yellow rectilinear contours are snow growth, and the red and blue contours are omega. The green bars are rain amounts, and the blue bars snow. Some of the things to note in these cross sections are the omega/snow growth "cross hair," freezing level, and rapid decrease in humidity with the frontal passage.

What the discrete NAM forecast can't show is the variability of the forecast situation. In its most recent release BUFKIT added support for SREF and eWRF ensembles. When combined with BUFKIT's precipitation type and other tools, ensemble forecasts can provide much additional information and insight. In this case eWRF ensemble members for VNY exhibited widely varying thermal profiles, regions of snow growth, omega, and humidity. BUFKIT's Bourgoiun precipitation type analysis for the eWRF ensemble members at 8:00 a.m. Saturday morning showed freezing levels as high as 2882' and as low as 1176'. The pattern of post-frontal precipitation was also quite variable.

More information concerning Southern California weather can be found using our WEATHER LINKS page.

Thursday, 03 March 2011 08:58:48 (Pacific Standard Time, UTC-08:00)  #    Disclaimer  |   |