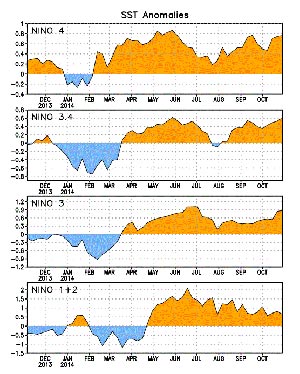

SST NINO Region Anomalies
From the CPC ENSO Diagnostic Discussion 11/6/2014.
One thing is very clear; we have a lot to learn about the atmosphere's response to anomalously warm equatorial Pacific SSTs. It's difficult to imagine a better scenario for El Niño development than the conditions seen in the equatorial Pacific earlier this year.
After being negative for 42 out of the previous 43 months, the Pacific Decadal Oscillation (PDO) index turned positive in January 2014 and has remained positive through the summer. Beginning in January and ending in late June the downwelling phase of a very strong Kelvin wave propagated across the Pacific, with upper ocean area-averaged heat content anomaly between 180 and 100W peaking at the end of March. Since January there have been westerly wind bursts and periods of increased low-level westerly zonal wind anomalies of variable duration and extent.
The Oceanic Niño Index (ONI) jumped from -0.5 in the FMA season to -0.1 in MAM, and then to +0.1 in AMJ. During that same period the Multivariate ENSO Index (MEI) jumped from a rank of 35 in MARAPR to 59 in APRMAY -- a value that put it on the doorstep of a strong El Nino ranking. Which all looked supportive of at least a moderate El Nino developing.
But it didn't. After climbing up to 0.6 °C in late May, Nino 3.4 region SST anomalies dropped to below 0.0 °C in late July. Since then a more modest downwelling Kelvin wave has restored some of the basin heat content and Nino 3.4 anomalies have rebounded back to 0.6 °C.
So what's next? While El Nino development still appears to be possible this Winter, it would be one of the two latest developing El Ninos in the record from 1950 to the present -- the other being 1952-53. One possibility is that this year's vacillations are the precursor to the EARLY development of an El Nino event next year.
One worrisome detail is that the Global Wind Oscillation (GWO) has been behaving similarly to the failed El Nino of 2012. Compare this plot of the GWO from June 1 to October 31 of this year to the plot of the GWO from June 1 to October 31, 2012. In both 2014 and 2012 the GWO has shown a neutral or weak La Nina-like response. The GWO for the period June 1 to October 31, 1997 is an example of a definitive atmospheric response to strong El Nino conditions.
On a more positive note, a relatively strong, but fast-moving Pacific cold front and trough resulted in rain and snow in California over Halloween. In the Los Angeles area rainfall amounts generally varied from around 0.3 inch to 0.75 inch or so with isolated amounts as high as about 2.0 inches in the mountains. Here are some tabulated rainfall amounts from around the area from the NWS Los Angeles/Oxnard and NWS San Diego.
The 1981-2010 climate normal average rainfall for Downtown Los Angeles in November is 1.04 inches. Month to date we're about average for the date, and water year to date we're ahead of last year, but about 0.6 inch below normal.
Based on the current GFS and ECMWF forecasts those deficits are probably going to increase over the next two weeks, but it is way too early in the rain season to attribute the dry weather to a continued dry pattern. El Niño or not; dry November or not; the switch from a cold Pacific to a warm Pacific is a significant change and one that some guidance suggests should increase our rainfall. We'll see!
More information about Southern California weather and climate can be found using our WEATHER LINKS page.