Page 1 of 2 in the recordRainfall category Next Page
# Friday, August 31, 2018

Color-coded Los Angeles (KCQT) Precipitation - July 1877 to June 2018
Color-coded Los Angeles (KCQT) Precipitation
July 1877 to June 2018

The graphic above is color-coded chart of Los Angeles (KCQT) rain year precipitation from 1877 to 2017, a period of 141 years. Years progress from left to right. The rain year is from July 1 of the indicated year to June 30 of the following year. Colors are indicative of the following amounts of rain:

Red: VERY DRY - less than 5 inches of rain.
Orange: DRY - more than 5 inches of rain, but less than 13 inches.
Light blue: ABOUT AVERAGE - more than 13 inches of rain, but less than 17 inches.
Blue: WET - more than 17 inches of rain, but less than 22 inches.
Dark Blue: VERY WET - more than 22 inches of rain.

Following are some observations regarding Los Angeles rainfall:

- VERY DRY and DRY years (orange & red) have been more common than VERY WET and WET years (blue & dark blue). In the first 70 years there were a few more dry years than wet years (30 vs. 25). In the last 70 years there have been about twice as many dry years as wet years (41 vs 20).

- Extended dry periods (orange & red) have been more common than extended wet periods (blue & dark blue) and generally last longer. The longest uninterrupted dry period is 7 years, while the longest wet period is only 3 years. If we allow for one interceding year, the longest dry period is 11 years and the longest wet period is 5 years.

- There were no VERY DRY years (red) prior to 1960 and three of the four VERY DRY years have occurred since 2001.

- ABOUT AVERAGE years (light blue) have not been common. Only 24 of 141 years (17%) have had ABOUT AVERAGE rainfall. The first 70 years had 15 ABOUT AVERAGE years and the last 70 years had 9 ABOUT AVERAGE years.

- Overall, VERY WET years (dark blue) have been more common than VERY DRY years (red), but in the last 30 years the number of VERY WET years (4) and VERY DRY years (3) have been about equal.

- Consecutive VERY WET (dark blue) or VERY DRY years (red) have been rare. There has been one instance of back-to-back VERY WET years (1956 & 1957) and no instances of back-to-back VERY DRY years.

Here is a PDF of the rainfall chart. The chart includes the January - December precipitation amounts for each year, as well as the rain year value.

More information about Southern California weather and climate can be found using our WEATHER LINKS page.

Friday, August 31, 2018 8:28:18 AM (Pacific Daylight Time, UTC-07:00)  #    Disclaimer  |   | 
# Tuesday, January 24, 2017

California Percent of Normal Precipitation for July 1 to January 22, 2017 (WRCC) Click
California Percent of Normal Precipitation (WRCC)
July 1, 2016 to January 22, 2017

Update on February 2, 2017. Downtown Los Angeles has ended January 2017 with 8.38 inches of rain. This is 269% of the normal January rainfall total of 3.12 inches. The preliminary Rain Year precipitation total for Downtown Los Angeles for July 1 through January 31, 2017 is 14.33 inches, which is 193% of the normal amount of 7.44 inches. Here is an updated California Percent of Normal Precipitation map from the Western Regional Climate Center for July 1, 2016 to January 31, 2017.

On the heels of a wet December, a series of Pacific storms have resulted in the wettest start to the Rain Year (July 1 - June 30) and Water Year (October 1 to September 30) since the very wet year of 2004-2005.

The six day period from January 18-23 was particularly wet, with three storms producing a total of 5.53 inches of rain at Downtown Los Angeles (USC). Here are some preliminary 7-day precipitation totals from around the area from the Ventura County Watershed Protection District.

The last system of the series, which brought very heavy precipitation to the area on Sunday, was associated with a well-defined atmospheric river. Precipitation totals in the Los Angeles area for the storm generally ranged from about 2 to 5 inches. According to the NWS, new rainfall records for January 23 were set at Los Angeles Airport (2.94 inches), Camarillo (2.74 inches) and Long Beach Airport (3.97 inches). The rainfall at Long Beach Airport was the most ever recorded in a day at that location. Here are some precipitation totals from around the area compiled by the NWS Los Angeles/Oxnard and NWS San Diego.

As of yesterday Downtown Los Angeles (USC) has recorded 14.33 inches of rain for the Rain Year. This is 217% of the normal amount of 6.65 inches for the date, and 97% of the normal amount of rainfall for an entire year. Assuming we don't get any more rain this January, the 8.38 inches recorded will work out to 269% of the normal amount for the month.

The California Cooperative Snow Surveys Snow Water Equivalents report for today puts the snowpack for the date at an average 197% of normal. That's two times the normal amount.

A little precipitation has crept back into the GFS, GEFS and ECMWF forecasts for the Los Angeles area the first week of February. We'll see!

More information about Southern California weather and climate can be found using our WEATHER LINKS page.

Tuesday, January 24, 2017 7:10:12 PM (Pacific Standard Time, UTC-08:00)  #    Disclaimer  |   | 
# Tuesday, July 28, 2015

NRL GOES E/W Composite VIS/IR (Day/Night) - Saturday, July 18, 2015 5:00 PM PDT Click
NRL GOES E/W Composite VIS/IR (Day/Night)
Post-tropical remnant low Dolores is west of Baja
Saturday, July 18, 2015 5:00 PM PDT.

Downtown Los Angeles (USC) ended the 2014-2015 rainfall year (July 1 - June 30) with 8.52 inches of rain; well below the normal of 14.93 inches. It was the fourth consecutive year of below normal rainfall in Los Angeles and much of Southern California.

To kick off the new new rainfall year two waves of moisture and instability associated with ex-hurricane Dolores, other tropical sources, and a strong monsoonal flow from Baja resulted in record-setting rainfall in Southern California from Saturday July 18 to Monday July 20.

Constructive interference of the El Nino base state by the active phase of the MJO resulted in negative 200-hPa velocity potential anomalies and enhanced convection in the Eastern Pacific during the first half of July. This appears to have contributed to the rapid development of Dolores from a tropical depression on July 11 into a Category 4 hurricane July 15. Anomalously warm SSTs in the tropical and sub-tropical Eastern Pacific also played a role, helping to maintain the strength of Dolores and increasing the amount of water vapor entrained by the system and transported into Southern California.

Many stations set new records, not only for the date, but for any day in July. Downtown Los Angeles (USC) set rainfall records for the date on Saturday and Sunday and tied Monday's record. Downtown Los Angeles recorded 0.36 inch of rain Saturday. This is more rain than any day in any July since recordkeeping began in 1877. That one day of rainfall even broke the monthly record for July in Los Angeles! Prior to this event the wettest July on record was in 1886, when 0.24 inch was recorded.

There was very heavy rain in the mountains on Sunday, with rain rates exceeding an inch a hour. From 5:15 p.m. to 5:25 p.m. a CBS Radio weather station on Mt. Wilson recorded a half-inch of rain in just 10 minutes!

Though the rain created its own problems -- including flash floods, debris flows and rock slides -- the soaking rains helped quell the Pines Fire near Wrightwood and the North Fire near Cajon Pass. Over the three day period from Saturday to Monday the Big Pines Remote Automated Weather Station (RAWS), near the Pines Fire, recorded 3.12 inches of rain. Several stations in the San Gabriels recorded more than three inches of rain, including Clear Creek and Opids Camp. Here's a NWS compilation of some rainfall totals in the Los Angeles forecast area and the San Diego forecast area.

After dawdling around for several months our on again, off again El Nino is finally firing on all cyclinders and could reach ONI and MEI levels not seen since 1997-98 and 1982-83. The Multivariate ENSO Index (MEI) for May-June was 2.06. This was the third highest value for the season, exceeded only in 1983 (2.2) and 1997 (2.3). It is the second highest for the season during the development phase of an El Nino event. The 2015 April-May-June Oceanic Nino Index (ONI) value of 0.9 was higher than than in 1982 (0.6) and 1997 (0.6). Several dynamical models in the IRI/CPC ENSO Predictions Plume of forecast Nino 3.4 SST anomaly, released July 16, project Nino 3.4 SST anomalies in excess of 2.5°C this fall.

Analysis of correlations of CMAP Precipitation with globally integrated atmospheric angular momentum using ESRL/PSD's Linear Correlations in Atmospheric Seasonal/Monthly Averages tool suggests that precipitation in the southern half of California is more strongly correlated with atmospheric angular momentum (AAM) than with Nino 3.4 SST. For example, compare the correlation of CMAP Precipitation to AAM and to Nino 3.4 SST for Dec-Jan-Feb 1980-2012. Cyclical increases in relative atmospheric angular momentum are often associated with El Ninos. This can be seen in the plots of the Global Wind Oscillation in my El Nino Comparison Chart.

After being negative for 3 1/2 years, the PDO Index has been positive since January 2014. December's PDO value of 2.51 was the highest for that month on record since 1900. June's value of 1.54 was the 13th highest since 1900.

More information about Southern California weather and climate can be found using our WEATHER LINKS page.


Tuesday, July 28, 2015 8:07:55 AM (Pacific Daylight Time, UTC-07:00)  #    Disclaimer  |   | 
# Sunday, December 7, 2014

CNRFC 96 Hr Gridded Precipitation Totals for the Four-Day Period Ending 12/04/2014 4:00 am Click
CNRFC 96 Hr Gridded Precipitation Totals
For the Four-Day Period Ending 12/04/2014 4:00 am.

After being negative for 3 1/2 years, the PDO Index has been positive since January 2014. October's PDO value of 1.49 is the 6th highest for that month since 1900 and comparable to PDO Index values in October 1997, 1957, 1993, and 1987.

PDO/AMO-based Precipitation composites suggest a warm Pacific generally produces more Winter precipitation in California than a cold Pacific. This makes sense. Among other effects a warm Pacific increases evaporation, air temperature, and the amount of water vapor transferred to the atmosphere. This in turn can increase precipitation. Here is a comparison of Pacific SST anomalies at the beginning of December 2014 and December 2013. Mouse over the image to switch to the December 1, 2013 image.

A warm Pacific may have contributed to the amount of precipitation produced in California by a large Pacific upper level low this past week. Two periods of rain were observed in Southern California -- one on Sunday and the other on Tuesday and Wednesday.

Sunday an embedded short wave in the moist southerly flow produced more rain than expected in many areas of Los Angeles. Surprisingly high rain rates and amounts in the Santa Monica Mountains, resulted in debris flows in the Springs Fire burn area that closed PCH. Here's a NWS compilation of some rainfall totals in the forecast area.

Even with the parent low lifting to the north on Tuesday and the 570 mb contour near Santa Barbara, the very moist southerly flow orographic lift and sufficient dynamics produced widespread precipitation in Southern California with some impressive precipitation totals. Tuesday record rainfall for the date occurred at both Downtown Los Angeles and Downtown San Francisco. Yucaipa Ridge in the San Bernardino Mountains recorded a whopping three-day rainfall total of 14.6 inches. Following are three-day rainfall compilations from the NWS Los Angeles/Oxnard and NWS San Diego.

Here are graphics from the CNRFC with gridded precipitation totals for the four day period from early Sunday morning to early Thursday morning for Southern California, the Sierra Nevada and the San Francisco Bay Area. Some preliminary precipitation totals of 5 inches or more are noted.

Equatorial Pacific SSTs continue to rebound with OISST.v2 Nino 3.4 SST Anomalies above 0.5 °C for the past seven weeks and now stand at 1.0 °C for the week centered on November 26, 2014. The Multivariate ENSO Index (MEI) for OCT/NOV has increased 0.35 SD to 0.71, increasing its historic rank (since 1950) from 42 to 47, just within the MEI's weak El Nino threshold. However as noted by the CPC in their December 4, 2014 ENSO Diagnostic Discussion, "the overall atmospheric circulation has yet to show a clear coupling to the anomalously warm waters." The FNL Global Wind Oscillation for the past 90 days continues to reflect the lack of definitive atmospheric coupling

For now the Pacific storm door appears to be open. Most medium-range guidance is suggesting another significant system will be affecting California in the Thursday-Friday timeframe. We'll see!

More information about Southern California weather and climate can be found using our WEATHER LINKS page.


Sunday, December 7, 2014 1:33:07 PM (Pacific Standard Time, UTC-08:00)  #    Disclaimer  |   | 
# Sunday, December 15, 2013

Experimental PSD Precipitation Forecast Guidance Click
Experimental PSD Precipitation Forecast Guidance
Issued November 19, 2013.
Prepared by Klaus Wolter, CIRES & NOAA-ESRL PSD

An experimental PSD forecast issued November 19, 2013 for the period December 2013 through February 2014 prepared for the California DWR by Dr. Klaus Wolter of the Cooperative Institute for Research in Environmental Sciences at the University of Colorado shows a significantly increased chance of less than normal precipitation in most of Southern California and the Central San Joaquin Valley. The forecast guidance shows the shift in tercile probabilities for precipitation, similar in concept to the NOAA CPC precipitation outlooks.

According to Dr. Wolter the statistical forecast scheme integrates as many of the known influences on California's climate as possible, using data from 1950 onwards. In the absence of El Nino and La Nina influences considerations such as the status of the Pacific Decadal Oscillation (PDO), the Atlantic Multidecadal Oscillation (AMO), or recent Alaskan temperatures can be evaluated through statistical models to make a forecast.

Dr. Wolter also produced composite precipitation anomalies for the periods October-December and January-March for years with comparable PD0-AMO indices. In Southern California the Oct-Dec anomalies were -0.5 to -0.7 SD below the 1895-2000 Longterm Average and the Jan-Mar anomalies were -0.1 to -0.3 SD below average.

Since October 1 precipitation in California, Oregon and Washington has generally been well below normal. As of today the precipitation recorded at Downtown Los Angeles is at about 30% of normal for the water year (July 1-June30). If Los Angeles doesn't record more than 0.58 inch of rain over the remainder of December, 2013 will rank as the driest calendar year on record.

A wildcard in the California precipitation outlook is the occurrence of atmospheric rivers such as those that occurred at the end of November 2012 and during December 2010. An analysis of all winter ARs in California during WY1998–2011 presented in the paper The 2010/2011 snow season in California's Sierra Nevada: Role of atmospheric rivers and modes of large-scale variability by Bin Guan, et.al., found that atmospheric river frequency is increased during negative phases of the Arctic Oscillation (AO) and the Pacific-North American (PNA) teleconnection patterns.

More information about Southern California weather and climate can be found using our WEATHER LINKS page.


Sunday, December 15, 2013 3:34:32 PM (Pacific Standard Time, UTC-08:00)  #    Disclaimer  |   | 
# Sunday, October 20, 2013

CPC Dec-Jan-Feb Precipitation Outlook Click
CPC Dec-Jan-Feb Precipitation Outlook
Released October 17, 2013.

Updated November 5, 2013. My mistake -- a spreadsheet range error -- thanks for the heads up Reg! The driest January 1 to November 1 for Downtown Los Angeles was in 1972 with 0.92 inch. Here are the driest ten years for that period:

1. 1972 0.92
2. 2002 1.62
3. 1984 1.93
4. 1961 2.37
5. 1971 2.39
6. 1947 2.45
7. 2013 2.78
8. 1894 2.89
9. 1953 2.89
10. 2007 3.37

An energetic upper level low brought the first widespread precipitation of the rain season to Southern California October 9, with rain at the lower elevations and some snow in the local mountains. Rainfall amounts varied widely, ranging from a trace in some areas to over an inch in the mountains.

Downtown Los Angeles (USC) recorded only 0.04 inch for the storm, bringing the water year rainfall total to 0.13 inch, which is 0.31 inch below normal. Downtown Los Angeles has recorded only 2.76 inches of rain since January 1. This is one of the driest January 1 - October 20 in Los Angeles over the past 135 years! To get out of the bottom ten for calendar year rainfall Los Angeles needs about 3.5 inches of rain by December 31. Normal rainfall for November is 1.04 inches and for December is 2.33 inches.

For months I've been monitoring climate data and forecasts looking for something on which to base a 2013-14 Winter precipitation Outlook. Historically ENSO has played the major role in Southern California rain season weather, with El Nino conditions generally producing wetter weather and La Nina conditions generally drier. But ENSO conditions are currently Neutral and are expected to remain so through the end of the year.

Most climate models forecast slow warming of SSTs in the equatorial Pacific (NINO 3.4 region) over the next several months, but at this time of the year it would be very unusual to have substantial warming. The CPC/IRI ENSO Forecasts from IRI's October Quick Look indicate the probability of an El Nino developing before the end of the year is less than 20% -- and 20% seems high.

One computer model that at times has been forecasting above average precipitation in Southern California this Winter is the Climate Forecast System version 2 (CFSv2). The CFSv2 is fully coupled ocean-atmosphere-land-sea ice model used to forecast parameters such as sea surface temperature, temperature and precipitation rate. While skillful at predicting tropical SSTs, the CFSv2 generally performs very poorly when forecasting precipitation over land, so forecasts such as this earlier one for Dec-Jan-Feb must be viewed somewhat skeptically.

Another glass half-full observation is that the Madden-Julian Oscillation (MJO) has been relatively active this year and if this activity continues it provides recurring opportunities for enhanced U.S. West Coast precipitation. The downside is that it can result in periods of dry weather as well.

With the ocean and atmosphere neutral there's just not much on which to base a rain season forecast. As a result of the government shutdown the release of the official NOAA 2013-14 Winter Outlook has been delayed until November. The October CPC outlook is usually the basis of the initial official NOAA U.S. Winter Outlook. The U.S. Dec-Jan-Feb Precipitation Outlook, released October 17, calls for an equal chance of below average, average, or above average precipitation for all of California. We'll see!

More information about Southern California weather and climate can be found using our WEATHER LINKS page.

Sunday, October 20, 2013 3:31:26 PM (Pacific Daylight Time, UTC-07:00)  #    Disclaimer  |   | 
# Friday, October 12, 2012

Click
Cut-off Upper Level Low
GOES-15 Water Vapor Image - 1:30 p.m. Thursday.

Instability associated with a cut-off upper level low resulted in scattered strong thunderstorms and widespread showers in Southern California on Thursday. A GOES Sounding 8 nm NW of KLAX at 3:00 pm indicated an LI of -4 and CAPE of 836.

According to NWS Storm Reports a spotter in Simi Valley area near Tapo St. and the 118 Frwy reported 1.0 inch of rain in 15 minutes and 1.5 inches in 30 minutes with street flooding. A Mesonet station in Simi Valley recorded 0.84 inches of rain in 12 minutes. A Mesonet station near Pasadena recorded 1.1 inches in 25 minutes. Long Beach Airport set a new rainfall record for the date of 0.30 inches.

The rain gauge at Downtown Los Angeles (USC) dodged all but a few rain drops, recording 0.01 inch for the storm. Here's an archived copy of a NWS compilation of preliminary rainfall totals across the area.

More information about Southern California weather and climate can be found using our WEATHER LINKS page.

Friday, October 12, 2012 4:53:51 PM (Pacific Daylight Time, UTC-07:00)  #    Disclaimer  |   | 
# Saturday, April 14, 2012

WSI Intellicast.com Composite Radar Image from Friday, April 13, 2012 at 11:00 am PDT Click
WSI Intellicast.com Composite Radar Image
Friday, April 13, 2012 at 11:00 am PDT

Some of the video of yesterday's rainstorm looked more like coverage of a hurricane rather than an April storm in Los Angeles. There were flooded streets and creeks, lightning strikes of aircraft and gas lines, strong winds, waterspouts, hail, toppled trees, mountain snow and more. Downtown Los Angeles (USC) set a new rainfall record for the date of 0.49 inches, breaking a record set in 1956.

The system's strong dynamics were due in part to upper level divergence associated with an ideally positioned jet max and strong positive vorticity advection. The result was strong omega, with 12z NAM vertical velocities at KVNY on the order of -25 microbars per second from 900 mb to 600 mb.

Apirl's above average rainfall has increased the water year (July 1 to June 30) rainfall total for Downtown Los Angeles to 8.19 inches, which is about 58% of normal. Here are some preliminary rainfall totals from around the area for the storm earlier in the week and yesterday's storm compiled by the NWS, and a snapshot of a Ventura County Watershed Protection District Google Map (large image) with some rainfall totals for the past week.

More information about Southern California weather and climate can be found using our WEATHER LINKS page.

Saturday, April 14, 2012 1:49:05 PM (Pacific Daylight Time, UTC-07:00)  #    Disclaimer  |   | 
# Thursday, June 30, 2011

Click
GOES-11 Water Vapor Image
Tuesday June 28, 2011 - 2:30 pm PDT

Tuesday a front associated with an unseasonably strong Pacific low pressure system broke rainfall records in much of the northern half of the state. Precipitation records for the date were broken in numerous locations, including Monterey, San Jose, Oakland, San Francisco, Napa, Sacramento, Redding, Eureka and Crescent City. Here are archived copies of record reports from the San Francisco Bay/Monterey NWS Office and the Sacramento NWS Office.

The front and trough produced a few clouds and cooled temperatures in the Los Angeles area, but I didn't see any reports of rain. Downtown Los Angeles (USC) will end the July 1, 2010 to June 30, 2011 water year with 20.20 inches of rain. This is about 133% of the climate normal of 15.14 inches. According to NWS data Camarillo/Oxnard recorded 139% of normal rainfall, Long Beach 145%, Santa Barbara 169% and Palmdale 105%.

Looks like temperatures will be warming up for the July 4th weekend. Temperatures are expected to reach into the 80s at the coast, 90's inland and 100's in the valleys. Desert areas could reach 110 or higher. Models suggest the possibility of some monsoon moisture moving into the area Sunday or Monday, along with a chance of thunderstorms in the mountains and deserts. Check the NWS Los Angeles/Oxnard Office for the latest forecasts and warnings.

More information about Southern California weather and climate can be found using our WEATHER LINKS page.

Thursday, June 30, 2011 3:30:58 PM (Pacific Daylight Time, UTC-07:00)  #    Disclaimer  |   | 
# Tuesday, June 7, 2011

Click
Aqua-MODIS Composite Satellite Image (NRL)
Saturday, June 4, 2011

An unseasonably strong Pacific low pressure system that stalled about 200 NM off the Central Californio coast set new rainfall records from San Francisco to Santa Barbara over the weekend. The N-S oriented front associated with the system was positioned over Santa Barbara and San Luis Obispo counties much of the weekend, resulting in unusually high rainfall totals in some areas. Midday Sunday the upper low began to move east along 35°N, increasing divergence aloft in areas north of Pt. Conception and producing additional precipitation Sunday afternoon and evening.

Saturday a new rainfall record for the date was set in San Francisco; and on Saturday and Sunday new rainfall records were set in Stockton, Modesto, Paso Robles and Santa Maria. Sunday Santa Barbara Airport recorded 1.24 inches of rain, breaking the record for the date, and increasing the station's rainfall total for June to the highest since recordkeeping began in 1941. The dissipating front produced some scattered showers in the Los Angeles area Sunday.

There were some impressive storm totals. Nordhoff Ridge, in Ventura County, recorded 1.07 inches of rain; Refugio Pass, in Santa Barbara County, 2.64 inches; and Rocky Butte, in San Luis Obispo County, 3.94 inches. Downtown Los Angeles (USC) recorded a trace of rain on Sunday, leaving our water year (July 1 to June 30) rainfall total at 20.19 inches. Here is an archived copy of a NWS Los Angeles/Oxnard compilation of some rainfall totals from around the area.

Saturday I did a trail run on the 8000-9000 ft. ridge between Mt. Pinos and Mt. Abel, north of Los Angeles, and was able to observe first-hand the very strong southerly flow associated with this system, and the spectacular wave clouds that resulted.

More information about Southern California weather and climate can be found using our WEATHER LINKS page.

Tuesday, June 7, 2011 11:43:44 AM (Pacific Daylight Time, UTC-07:00)  #    Disclaimer  |   | 
# Monday, May 16, 2011

Click
BUFKIT - Precipitation and Temperature Forecast
WRF Ensemble for VNY 05/16/11 12z

Overall it's been a wet water year in Southern California, but in the fashion of a Mediterranean climate the wet water year has been comprised of a patchwork of wet and dry months.

If it were not for an unusually stormy December in which Downtown Los Angeles recorded 8.32 inches more rain than normal, Los Angeles would be looking at about 76% of normal rainfall this water year instead of 131%. This reduced amount would be more typical of the rainfall recorded in Los Angeles during a La Nina influenced water year.

March was wet, but April and May have been dry. Sunday morning's wet weather added 0.07 inch to May's total for Los Angeles, but the combined April/May rainfall deficit is still about 0.9 inch.

BUFKIT analysis of WRF ensemble data for Van Nuys and LAX suggests tomorrow's storm is likely to produce between 0.1 inch and 0.3 inch of rain in the Los Angeles basin, and perhaps up to 0.4 inch in the San Fernando Valley. SREF Ensemble probabilities and HPC Probabilistic Precipitation Guidance support this estimate.

It won't take a lot of rain to break the record for May 17 at Downtown Los Angeles -- 0.18 inch would do it -- and it would also raise the water year rainfall total for Los Angeles to over 20 inches. The previous precipitation record for May 17 was 0.17", set in 1883. Note: Record for USC Campus (KCQT) is 0.06, set in 1949, but data from Civic Center is used for Downtown Los Angeles records prior to 1921.

There's a chance of more rain Wednesday, and then perhaps again Sunday into Monday. We'll see!

Update Tuesday, May 17, 2011. Rainfall amounts from the storm that affected Los Angeles last night and this morning were generally within the range projected by the WRF ensembles. Downtown Los Angeles (USC) recorded 0.15 inch for the storm, bring the water year total to 19.99 inches. Here's a report compiled by the NWS with some rainfall totals from around the area. Tonight's system is forecast to produce similar rainfall totals. At the moment some drizzle or light rain looks like a possibility in the Los Angeles area Sunday and early Monday.

Update Wednesday, May 18, 2011. Thanks to the system that moved into the area last night, Downtown Los Angeles (USC) recorded additional rainfall Tuesday evening, nudging the rainfall total for May 17 up to 0.18 inch, and breaking the old rainfall record for the date set in 1883. Shower activity appears to be winding down and partly cloudy skies are forecast for Los Angeles this afternoon. Rainfall totals from the second system were generally similar to Tuesday's amounts. Here's a report compiled by the NWS Los Angeles/Oxnard that lists the cumulative rainfall that has resulted from these two storms for a number of stations around the area. The water year total for Downtown Los Angeles (USC) now stands at 20.19 inches.

More information about Southern California weather and climate can be found using our WEATHER LINKS page.

Monday, May 16, 2011 7:32:59 PM (Pacific Daylight Time, UTC-07:00)  #    Disclaimer  |   | 
# Monday, March 21, 2011

Click
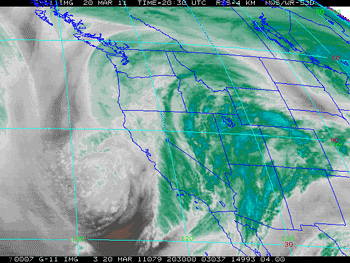
GOES-11 Water Vapor Satellite Image
Sunday, March 20, 2011 at 1:30 p.m.

Running in the rain and wind, and splashing through innumerable puddles, Markos Geneti set a new Los Angeles Marathon record in a time of 2:06:35. It was a remarkable performance, in adverse conditions. From 8:00 a.m. to 12:00 p.m. the Mt. Washington RAWS, near the start of the marathon, recorded 0.59 inches of rain; and the Beverly Hills RAWS near mile 17, recorded 1.27 inches. Periods of heavy rain were reported at Santa Monica Airport, near the finish line, through much of the race. According to a report in the Los Angeles Times sports blog, The Fabulous Forum, thousands of runners were evaluated for hypothermia and 25 runners were hospitalized.

Many rainfall records were set around the area Sunday, with some locations recording as much as one-third of a year's normal rainfall in 24 hours! In the early evening rainfall rates of over an inch an hour were recorded in Woodland Hills and Canoga Park. According to a NWS Storm Report, at 6:14 p.m. a flash flood was reported in Woodland Hills with "mud and debris flowing down the street" and "at least four to five vehicles stuck in flowing water."

Downtown Los Angeles (USC) recorded 2.42 inches of rain yesterday, breaking a record set in 1943. Santa Barbara Airport had its wettest day on record, recording 5.23 inches of rain. Here's an archived copy of the NWS Record Report for March 20, listing some of the rainfall records for the day.

Storm totals in excess of 3 inches have been common in Los Angeles, Ventura, Santa Barbara, and San Luis Obispo counties. Higher totals were recorded in many areas. As of 5:00 p.m. the NWS reported that Van Nuys had recorded 6.74 inches of rainfall, Northridge 6.08 inches, Newhall 7.20 inches, Santa Barbara Airport 6.27 inches, San Marcos Pass 10.72 inches, and Gibraltar Dam 11.73 inches. Here's an archived copy of a NWS report with some rainfall and snowfall amounts from around the area.

Downtown Los Angeles made up its rainfall deficit for the month of March and more, increasing its water year rainfall total to 18.55 inches, or about 123% of normal. This makes the 2010-2011 water year the wettest in Los Angeles during a La Nina over the last 60 years, surpassing the totals recorded during the strong La Ninas of 1955-56 (99% of normal) and 1973-74 (106% of normal), and weak La Ninas of 1967-68 (110%) and 2000-01 (118%).

Sunday's heavy rain appears to have had the earmarks of an atmospheric river event. NRL SSM/I IPW imagery (lower right) shows a pre-frontal band of IPW values of 35-40 kg/m2 impinging the coast, NEDIS blended TPW imagery showed a band of ~25 mm TPW extending some 4000 km to the longitude of Hawaii. A BUFKIT cross section based on 12z NAM data for VNY depicted a low level jet (LLJ) structure coinciding with the period of heaviest rainfall. Research by Dr. F. Martin Ralph, et. al., observed that in atmospheric rivers over the eastern Pacific, 75% of the water vapor transport below 500 mb takes place within the lowest 2.25 km and occurs with LLJ wind structure. In addition in cases where a LLJ is present, there was 50% greater precipitation efficiency.

More information about Southern California weather and climate can be found using our WEATHER LINKS page.

Monday, March 21, 2011 4:09:13 PM (Pacific Standard Time, UTC-08:00)  #    Disclaimer  |   |