# Thursday, 20 January 2011

Click
Extended Pacific Jet and Resulting Mega-Ridge
GFS Forecast for Sunday Afternoon

Over the next two weeks, the MJO signal currently propagating across the western Pacific is forecast to destructively interfere with the La Nina base state, suppressing convection in the Indian Ocean and Indonesia and enhancing convection near the dateline. This is forecast to result in a transition from upper tropospheric anomalous cyclones to anticyclones near the dateline, and an extension of the East Asian/Pacific jet. These circulation changes may eventually lead to a retrogression of our persistent West Coast ridge, or perhaps a breakthrough of the westerlies underneath the highly amplified ridge.

The key word here is eventually. Over the next week or so, the extending Pacific jet is forecast to reamplify the ridge over the West Coast. But at some point, perhaps near the beginning of February, destructive interference in the Western Pacific will dwindle and convection in the Indian Ocean will strengthen. This should result in retraction of the Pacific jet, and possibly, a West Coast trough. The 240 hr forecast of the 12z ECMWF hinted at this possibility, as did the 18z GFS. We'll see!

After starting out cold and wet, the weather this January in Southern California, and much of the state, has been warm and dry. Monday, Pierce College in Woodland Hills hit a high of 88°F, and Downtown Los Angeles (USC) 84°F. So far this January, only 0.58 of rain has been recorded at Downtown Los Angeles (USC), which is a little less than one-third of normal for the month. However, because of our prodigious December rainfall the water year total at Los Angeles is currently 6.5 inches above the normal for the date of 5.78 inches.

Earlier this month I photographed these mid-level mammatus clouds over the western San Fernando Valley. They were produced by the moisture and dynamics associated with a closed upper level low that was about 390 miles WSW of Los Angeles. To see how the clouds evolved and more about the scenario at the time, see this post on PhotographyontheRun.com.

More information concerning Southern California weather can be found using our WEATHER LINKS page.

Thursday, 20 January 2011 19:25:42 (Pacific Standard Time, UTC-08:00)  #    Disclaimer  |   | 
# Sunday, 09 January 2011

Following is a chart comparing the 2010-11 La Nina to 22 other cold ENSO episodes that have occurred since 1949. With the exception of 1961-62 and 2008-09, the cold episodes are based on the Oceanic Niño Index (ONI) and are those specified in the CPC's tabulation of Cold & Warm Episodes by Season. A description of the parameters follows the chart. A GWO phase space plot is included for those cold episodes for which AAM data is available.

Year Nov-Mar
AAM
Peak MEI4 Peak MEI Season Peak
ONI
Peak ONI Season L.A. Rain GWO
Phase Plot
1949-501,2 -- -1.423 APRMAY -1.7 DJF 9.94 --
1950-511 -- -1.261 NOVDEC -1.0 NDJ, DJF 8.21 --
1954-551 -- -1.578 MAYJUN (54) -1.2 ASO 11.94 --
1955-561 -- -2.276 MAYJUN (55) -2.0 OND 16.00 --
1956-571 -- -1.516 MAYJUN (56) -0.9 SON, OND 9.54 --
1961-623 -0.511 -1.081 DECJAN -0.6 ASO, SON 18.79 Click for Nov-Mar GWO Phase Space Plot
1962-63 -1.254 -0.849 JANFEB -0.7 OND, NDJ 8.38 Click for Nov-Mar GWO Phase Space Plot
1964-65 -1.141 -1.496 JULAUG -1.2 SON, OND 13.69 Click for Nov-Mar GWO Phase Space Plot
1967-68 -0.767 -1.060 APRMAY -0.9 JFM 16.58 Click for Nov-Mar GWO Phase Space Plot
1970-71 -0.973 -1.898 MARAPR -1.3 DJF, JFM 12.32 Click for Nov-Mar GWO Phase Space Plot
1971-72 -0.172 -1.463 AUGSEP -1.0 OND 7.17 Click for Nov-Mar GWO Phase Space Plot
1973-74 -1.326 -1.937 DECJAN -2.1 NDJ 14.92 Click for Nov-Mar GWO Phase Space Plot
1974-75 -0.839 -1.256 OCTNOV -0.9 OND 14.35 Click for Nov-Mar GWO Phase Space Plot
1975-76 -0.711 -2.000 SEPOCT -1.7 OND, NDJ 7.22 Click for Nov-Mar GWO Phase Space Plot
1984-85 -0.595 -0.743 APRMAY -1.1 NDJ 12.82 Click for Nov-Mar GWO Phase Space Plot
1988-89 -1.135 -1.591 AUGSEP -1.9 OND, NDJ 8.08 Click for Nov-Mar GWO Phase Space Plot
1995-96 -0.226 -0.641 DECJAN -0.7 OND to JFM 12.46 Click for Nov-Mar GWO Phase Space Plot
1998-99 -0.539 -1.219 JANFEB -1.4 NDJ, DJF 9.09 Click for Nov-Mar GWO Phase Space Plot
1999-00 -0.778 -1.228 JANFEB -1.6 NDJ, DJF 11.57 Click for Nov-Mar GWO Phase Space Plot
2000-01 -0.795 -.747 OCTNOV -0.7 NDJ 17.94 Click for Nov-Mar GWO Phase Space Plot
2007-08 -1.007 -1.619 FEBMAR -1.4 DJF, JFM 13.53 Click for Nov-Mar GWO Phase Space Plot
2008-093 -0.594 -.783 SEPOCT -0.8 DJF 9.08 Click for Nov-Mar GWO Phase Space Plot
2010-11 -0.595 -2.037 AUGSEP -1.4 SON, OND, NDJ 20.20 Click for Nov-Mar GWO Phase Space Plot
1. AAM and AAM tendency anomaly data not available.
2. Based on ONI values beginning with DJF 1949-50.
3. ONI did not meet threshold of 5 consecutive overlapping seasons.
4. MEI values are normalized and may change as new data is added. Specified values were current as of November 8, 2011.

Nov-Mar AAM: The mean of the global relative atmospheric angular momentum anomaly for the period November 1 to March 31 of the following year. Data is from the GWO phase space data file linked on the Global Synoptic Dynamic Model page of the PSD Map Room Climate Products. Reference Weickmann and Berry, 2008.

Peak MEI: The peak seasonal value of the Multivariate ENSO Index (MEI). Reference Wolter and Timlin, 1993, 1998. MEI values are normalized and may change as new data is added.

Peak MEI Season: The peak bi-monthly season(s) for which the MEI is computed.

Peak ONI: The peak Oceanic Niño Index (ONI) based on SST anomalies in the Niño 3.4 region. Reference Climate Prediction Center Cold & Warm Episodes by Season.

Peak ONI Season: The peak tri-monthly season(s) for which the ONI is computed.

L.A. Rain: The water year precipitation total in inches for Downtown Los Angeles (USC). Reference NWS Los Angeles/Oxnard Downtown Los Angeles Climate Page, 1921-2006 Calendar Year Rainfall.

GWO Phase Space Plot: Plot of global relative atmospheric angular momentum anomaly vs. global relative atmospheric angular momentum tendency anomaly for the period November 1 to March 31 of the following year. Data is from the GWO phase space data file linked on the Global Synoptic Dynamic Model page of the PSD Map Room Climate Products. Reference Weickmann and Berry, 2008.

Sunday, 09 January 2011 15:02:14 (Pacific Standard Time, UTC-08:00)  #    Disclaimer  |   | 
# Saturday, 01 January 2011

Click
WRF Ensembles Projected Precipitation
Through Monday, January 3, 2011 at 4:00 a.m.

Up until a couple of days ago it looked like there might be some damp weather for the Rose Parade and even a better chance for the Rose Bowl game. An upper level low was the culprit, and they are notoriously difficult to model and forecast. The low is out there, it's just further to the north, and so is the rain.

How likely is rain on New Year's Day in Pasadena? Here's a plot generated on the Western Regional Climate Center web site, that shows the probability of various amounts of rain in a 1-day period at Pasadena. The probability of measurable rain (0.01 inch) in a 24 hour period around January 1 is about 20%, or about 1 in 5. As the rainfall amounts increase, the probability drops. The chance of 1.0 inch of rain is about 4%, or 1 in 25. Keep in mind that the probabilities indicated are for a 24 hour period. The chance of rain for the relatively short two hour duration of the Rose Parade is quite a bit less -- as history demonstrates.

Wednesday's cold front, the latest in our series of surprisingly frequent December weather systems, upped the water year rainfall total at Downtown Los Angeles (USC) to 11.70 inches. As of December 31, L.A.'s rainfall total is about 8 inches above normal, and more than three times the normal amount of rainfall for the water year to date. For the first six months of the 2010-11 water year, the rainfall total for Downtown Los Angeles is the fourth wettest in the 133 years that records have been kept. The water year starts on July 1 and ends June 30.

And we're not done yet. In a normal year, Downtown Los Angeles records about two-thirds of its annual rainfall in the months of January, February and March. This amounts to a little over 10 inches of rain. Depending on how you look at the data, rainfall for Downtown Los Angeles during a La Nina episode is usually about 70%-80% of normal. In addition, the composite plus trend plot for Jan-Feb-Mar precipitation anomaly (from CPC) is particularly dry in coastal Southern California, indicating negative anomalies in excess of 3 inches, with a high frequency of occurrence. Even so, it looks like Los Angeles has a good chance of exceeding the normal amount of annual rainfall of 15.14 inches. All we need before June 30 is another 3.45 inches!

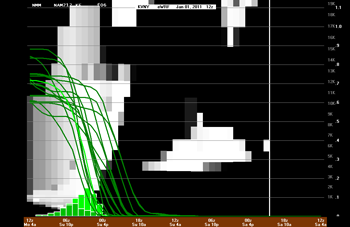
The upper level low postponed on account of the Rose Parade, but due in tomorrow, should help with that. BUFKIT analysis of this morning's WRF ensembles projects anywhere from 0.6 inch to 0.9 inch of rain at Van Nuys through early Monday morning. The 18z NAM isn't as wet, projecting about 0.4 inch. The models are still having difficulties with the forecast, and slight changes in the position and behavior of the upper low could have a significant impact on the amount of rainfall. We'll see!

More information concerning Southern California weather can be found using our WEATHER LINKS page.

Saturday, 01 January 2011 15:13:31 (Pacific Standard Time, UTC-08:00)  #    Disclaimer  |   |