# Sunday, 10 January 2010

Following is a chart comparing the 2009-10 El Niño to other warm ENSO episodes that have occurred since 1950. The warm episodes are based on the Oceanic Niño Index (ONI) and are those specified in the CPC's tabulation of Cold & Warm Episodes by Season. A description of the parameters follows the chart. With the exception of 1951-52, a GWO phase space plot is included for each warm episode. Data for 2009-10 will be updated periodically.

Year Nov-Mar
AAM
Peak MEI Peak MEI Season Peak
ONI
Peak ONI Season L.A. Rain GWO
Phase Plot
1951-521 -- 0.856 JULAUG 0.8 SON 26.21 --
1957-582 0.773 1.470 DECJAN, JANFEB 1.7 DJF 21.13 Click for Nov-Mar GWO Phase Space Plot
1963-64 0.046 0.858 OCTNOV, DECJAN 1.0 OND, NDJ 7.93 Click for Nov-Mar GWO Phase Space Plot
1965-66 -0.748 1.485 JULAUG 1.6 OND, NDJ 20.44 Click for Nov-Mar GWO Phase Space Plot
1968-69 0.513 0.834 JANFEB 1.0 DJF, JFM 27.47 Click for Nov-Mar GWO Phase Space Plot
1972-733 -0.239 1.804 JUNJUL 2.1 NDJ 21.26 Click for Nov-Mar GWO Phase Space Plot
1976-77 -0.828 1.046 AUGSEP 0.8 OND 12.31 Click for Nov-Mar GWO Phase Space Plot
1977-78 1.008 1.007 SEPOCT, OCTNOV 0.7 OND, NDJ, DJF 33.44 Click for Nov-Mar GWO Phase Space Plot
1982-83 2.337 3.109 FEBMAR 2.3 NDJ, DJF 31.25 Click for Nov-Mar GWO Phase Space Plot
1986-874 0.019 2.128 APRMAY 1.3 JFM 7.66 Click for Nov-Mar GWO Phase Space Plot
1987-884 1.000 2.013 JULAUG 1.6 JAS, ASO 12.48 Click for Nov-Mar GWO Phase Space Plot
1991-92 0.808 2.246 MARAPR 1.8 DJF 21.00 Click for Nov-Mar GWO Phase Space Plot
1994-95 0.764 1.346 SEPOCT 1.3 NDJ 24.35 Click for Nov-Mar GWO Phase Space Plot
1997-98 1.481 2.882 JULAUG 2.5 OND, NDJ 31.01 Click for Nov-Mar GWO Phase Space Plot
2002-03 0.324 1.230 DECJAN 1.5 OND 16.49 Click for Nov-Mar GWO Phase Space Plot
2004-05 0.747 0.924 FEBMAR 0.9 ASO 37.96 Click for Nov-Mar GWO Phase Space Plot
2006-07 -0.322 1.288 OCTNOV 1.1 OND, NDJ 3.21 Click for Nov-Mar GWO Phase Space Plot
2009-105 0.304 1.502 JANFEB 1.8 NDJ 16.36 Click for Nov-Mar GWO Phase Space Plot
1. AAM and AAM tendency anomaly data for 1951-52 not available.
2. AAM anomaly is average for Jan-Mar 1958.
3. Several MEI values were near 1.8 during 1972-73.
4. Continuous episode from JAS 1986 to JFM 1988.
5. Data as of June 30, 2010.

Nov-Mar AAM: The mean of the global relative atmospheric angular momentum anomaly for the period November 1 to March 31 of the following year. Data is from the GWO phase space data file linked on the Global Synoptic Dynamic Model page of the PSD Map Room Climate Products. Reference Weickmann and Berry, 2008.

Peak MEI: The peak seasonal value of the Multivariate ENSO Index (MEI). Reference Wolter and Timlin, 1993, 1998.

Peak MEI Season: The peak bi-monthly season(s) for which the MEI is computed.

Peak ONI: The peak Oceanic Niño Index (ONI) based on SST anomalies in the Niño 3.4 region. Reference Climate Prediction Center Cold & Warm Episodes by Season (1971-2000 climatology).

Peak ONI Season: The peak tri-monthly season(s) for which the ONI is computed.

L.A. Rain: The water year precipitation total in inches for Downtown Los Angeles (USC). Reference NWS Los Angeles/Oxnard Downtown Los Angeles Climate Page, 1921-2006 Water Year Rainfall.

GWO Phase Space Plot: Plot of global relative atmospheric angular momentum anomaly vs. global relative atmospheric angular momentum tendency anomaly for the period November 1 to March 31 of the following year. Data is from the GWO phase space data file linked on the Global Synoptic Dynamic Model page of the PSD Map Room Climate Products. Reference Weickmann and Berry, 2008.

Sunday, 10 January 2010 13:59:38 (Pacific Standard Time, UTC-08:00)  #    Disclaimer  |   | 
# Friday, 01 January 2010

NAM 500 mb Heights 12/05/09 18z Click
AHPS 90 Day Precipitation (Percent of Normal)

In terms of typical El Nino impacts, Southern California is still waiting. If you squint your eyes and have a good imagination, there is a hint of an El Nino rainfall pattern on the West Coast, but rainfall over much of our area ranges from a little below normal to a little above.

Including Wednesday's meager rainfall, Downtown Los Angeles is now about 1.1 inch above normal for the water year. That sounds great, but is a little deceptive. Some stations are well below normal and some well above. For example, Camarillo is 1.4 inches below normal, and Santa Barbara 2.3 inches above. According to the AHPS precipitation map, some mountain areas of Santa Barbara have had 200% of normal rainfall the past 90 days.

As expected, the Global Wind Oscillation (GWO) did orbit up into the positive AAM side of the phase space; but as feared, Indian Ocean/West Indonesian convection appears to have (once again) quashed the positive response. The average relative AAM anomaly for the period November 1 to December 29 remains slightly negative, and total global relative angular momentum is just about where it was at the beginning of November.

Updated January 2, 2010. Recent runs of the GFS show the Pacific jet extending and then collapsing into another trough off the West Coast during the week. This seems a little late to be directly related to the recent GWO phase 8-1 transition. A continued orbit of the GWO to phase 2 and 3 would be expected to shift the jet north and could result in another highly amplified wicked ridge of the west. Today's 18z run of the GFS plows the trough into a resistant ridge with most of the energy going up and over the ridge. The 12z ECMWF splits the trough and attempts to bring part of it in under the ridge. We'll have to see how things develop during the week.

More information concerning Southern California weather can be found using our WEATHER LINKS page.

Friday, 01 January 2010 21:38:03 (Pacific Standard Time, UTC-08:00)  #    Disclaimer  |   | 
# Wednesday, 16 December 2009

AHPS Observed Precipitation For 7-days Ending 12/15/09 at 4:00 a.m. PST Click
AHPS Observed Precipitation
For 7-days Ending 12/15/09 at 4:00 a.m. PST

Following several weeks of dry weather, a shift to a wetter pattern brought much needed rain and snow to California this past week. The pattern change was apparently induced by MJO enhancement of El Niño convection in the equatorial Pacific.

Downtown Los Angeles recorded 1.78 inches of rain from Thursday to Sunday, bringing the water year total to 4.81 inches. This is about 2.20 inches above normal for the date. Rainfall totals generally ranged from 2 to 4 inches in the basin and valleys, and 2 to 6 inches in the mountains. Here's an archived copy of a NWS Public Information Statement with rainfall totals from around the area.

Will the current El Niño produce the expected seasonal impacts in Southern California? A new tool that can help gain some insight into the linkage of climate and weather is the Global Wind Oscillation (GWO) phase space plot. Ed Berry repeatedly demonstrated the usefulness of this tool in his blog Atmospheric Insights. Although the blog has been discontinued, its content remains a valuable resource.

The GWO is a recurring subseasonal phenomenon that involves the transport and interchange of momentum in the earth-atmosphere system. It encompasses the MJO and occurs on a similar timescale. Analogous to the MJO phase space plot, but based on a framework of atmospheric angular momentum (AAM), the GWO phase space plot is a measure global relative atmospheric angular momentum and it's tendency. For details, see Weickmann & Berry, 2008.

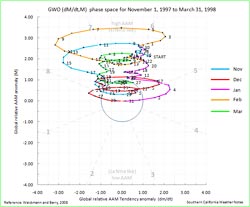
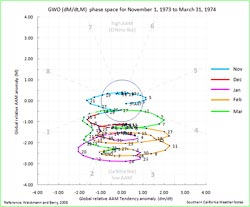
Relative AAM is generally positive during an El Niño and negative during a La Nina. Relative AAM is correlated with rain season precipitation in Southern California*, and can be helpful in assessing potential El Niño impacts. The following November to March GWO phase plots show the distinctly different behavior of the GWO during the strong El Niño of 1997-98, and the strong La Nina of 1973-74:

GWO El Niño 1997-1998 GWO La Niña 1973-1974
GWO El Nino 1997-1998
Click for larger image
GWO La Nina 1973-1974
Click for larger image

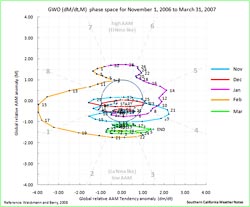
In a decade characterized by quirky El Niños, the El Niño of 2009-10 has been acting like another odd one. From a Southern California perspective, the concern has been that it might be like the El Niño of 2006-07 when Downtown Los Angeles recorded only 3.21" of rain over the water year. In the early stages of the El Niño of 2006 strong convection developed in the Indian Ocean during November, but an MJO did not develop until a second round of Indian Ocean convection occurred in mid December. Relative AAM remained negative, and in terms of the atmosphere, the 2006 El Niño didn't make it to 2007.

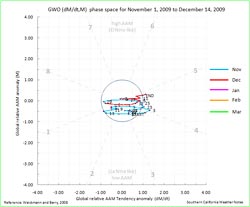
This year, Indian Ocean convection did spawn an MJO which eventually enhanced El Niño convection near the dateline. Significant momentum was added to the mid-latitudes of the Northern Hemisphere, energizing the westerlies and contributing to the pattern change that resulted in our recent wet weather. However, the increase in mid-latitude AAM has been mostly offset by negative anomalies at higher latitudes. Following are the GWO phase space plots for the current rain season to date, and the quirky El Niño of 2006-07.


GWO El Niño 2009-2010 GWO El Niño 2006-2007
GWO El Nino 2009-2010
Click for larger image
GWO El Nino 2006-2007
Click for larger image

So where do we go from here?. For at least a few days the storm track has shifted north. It appears the GWO might be starting an orbit that will take it farther into the El Niño side of the phase space. Several MJO forecasts show the next MJO cycle shortcutting it's orbit back into the Western Pacific. In the 6-10 day period, the GEFS ensemble MJO forecast indicates enhancement of equatorial convection around 90E, and suppression (by the MJO contribution) of El Niño convection near the dateline. This could modify any short term response of the El Niño signal and the GWO, once again reducing AAM.

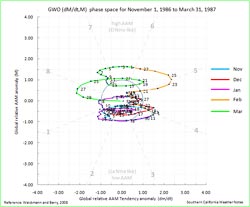
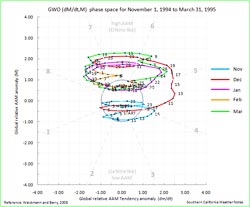
Below are the GWO phase plots for two El Niños with ONI and MEI values comparable to the current El Niño. In the 1986-87 El Niño, November to March AAM averaged 0.02, and it wasn't until February that the GWO climbed out of the AAM doldrums. That water year Los Angeles recorded 7.66 inches of rain. On the other hand, in the 1994-95 El Niño, November to March AAM averaged 0.76. In mid December the GWO began to reflect an ocean-atmosphere coupled El Niño response, and Los Angeles went on to record 24.35 inches of rain for the water year. At the moment it looks like Southern California might not be as dry as 1986-87, but probably not as wet as 1994-95. We'll see!

GWO El Niño 1986-1987 GWO El Niño 1994-1995
GWO El Nino 1986-1987
Click for larger image
GWO El Nino 1994-1995
Click for larger image

*1958-2008 Precipitation/AAM correlation plot generated using US Climate Division Dataset Seasonal Correlation Page.

More information concerning Southern California weather can be found using our WEATHER LINKS page.

Wednesday, 16 December 2009 13:40:43 (Pacific Standard Time, UTC-08:00)  #    Disclaimer  |   | 
# Saturday, 05 December 2009

NAM 500 mb Heights 12/05/09 18z Click
NAM 500 mb Heights 12/05/09 18z

Induced by MJO enhanced convection in the West Pacific, a change in pattern is underway which is expected to produce significant rainfall in California over the next week.

The first shortwave is forecast to ride down the east side of a very high amplitude blocking ridge along the West Coast, dig offshore on Sunday evening, and merge with another shortwave as the westerlies try to undercut the ridge on Monday.

It's an extraordinarily complex scenario, and just how it will play out is hard to say. A BUFKIT analysis of 18z NAM data generates about 1.2" at LAX and about 1.5" at VNY. Relatively strong south to southwest inflow is forecast and would be expected to produce higher precipitation amounts in favored foothill and mountain locations.

Mid-week the westerlies are forecast to break through underneath the ridge, opening the door to more wet weather.

Update 12/08/09 5:00 p.m. The best dynamics worked out to be south and east of Los Angeles county, and as this AHPS graphic shows that's where the most precipitation was recorded. But the Los Angeles area still received it's fair share of precipitation and managed to do so without inundating the areas burned in the San Gabriel Mountains by the Station Fire. This was due in part to the generally moderate rainfall rates and the low snow level. This Intellicast.com composite radar image from 2:30 Monday afternoon shows the jet enhanced precipitation to the south of the Los Angeles basin, and the frontal band north of the basin.

Over the course of the storm Downtown Los Angeles (USC) recorded 0.95 inches, bringing the water year total to 2.28 inches, which is about 0.75 inches above normal for the date. Here's an archived copy of a NWS Public Information Statement with rainfall -- and snowfall -- totals from around the area.

More information concerning Southern California weather can be found using our WEATHER LINKS page.

Saturday, 05 December 2009 15:43:09 (Pacific Standard Time, UTC-08:00)  #    Disclaimer  |   | 
# Friday, 20 November 2009

AHPS Observed Precipitation For 30 days Ending 11/20/09 Click
AHPS Observed Precipitation
For 30 days Ending 11/20/09

Drier than average weather in the Southwestern U.S., and wet weather in the Pacific Northwest in recent weeks has some folks wondering if the 2009-2010 El Niño is going to be another one of the quirky, underachieving El Niños we've been seeing this decade.

For much of September and October, the primary area of equatorial convection in the Eastern Hemisphere was in the Central Pacific, just west of the dateline. Convection was suppressed in the Indian Ocean. Such a pattern is consistent with El Niño.

Enhanced convection centered at about 160E in early October may have helped to extend the Pacific jet following an East Asian mountain torque event around October 5. This in turn may have contributed to an atmospheric river precipitation event in California October 13-14, 2009.

At that time it looked like we might finally be off and running with a "real" El Niño event. Particularly because during October equatorial Pacific SSTs and heat content anomalies increased dramatically. Theses increases were the result of of a strong Westerly Wind Burst (WWB), an associated downwelling Kelvin wave, and diminished tradewinds,

However -- and I think I hear Ed Berry's Rottweiler growling -- beginning in mid October, strong convection developed in the Indian Ocean. This essentially neutralized El Niño, and perhaps contributed to the La Nina like precipitation pattern we've been experiencing along the west coast of the U.S.

Indicative of the ocean-atmosphere issues, relative Atmospheric Angular Momentum (AAM) has been negative since early September, and the Global Wind Oscillation (GWO) has remained on the La Nina side of the GWO phase space.

Does this mean we've had an El Niño false alarm?

I wouldn't put away my rain gear just yet. Although November rainfall for Downtown Los Angeles is about 0.6 inch below normal, we usually only get about an inch of rain in November. And don't forget, because of the big storm in October, we are still about 0.6 inch ABOVE normal rainfall for the water year.

Update November 24, 2009. Current equatorial heat content anomalies are about the same as in 2006, not greater. See this composite TAO/TRITON section plot comparing equatorial heat content in 2006 and 2009.

And there are some positive signs. Equatorial Pacific SST and heat content anomalies are much greater than in the short-lived 2006 El Niño, and are more along the lines of those observed in the 2002-2003 El Niño. In addition, a strong MJO has developed. It has remained coherent, and is propagating eastward into the Western Pacific. It already appears to be helping to enhance convection in the Western and Central Pacific, and could kick-start the El Niño engine over the next week or two. We'll see!

More information concerning Southern California weather can be found using our WEATHER LINKS page.

Friday, 20 November 2009 07:32:56 (Pacific Standard Time, UTC-08:00)  #    Disclaimer  |   | 
# Thursday, 15 October 2009

AHPS Observed Precipitation For 7-days Ending 10/15/09 at 5:00 a.m. PDT Click
AHPS Observed Precipitation
For 7-days Ending 10/15/09 at 5:00 a.m. PDT

A potent early season Pacific storm carrying the remnants of West Pacific typhoon Melor has hammered California, setting numerous rainfall records, increasing stream flows, and producing heavy snow at the higher elevations of the Sierra.

Several stations, including some in Southern California, recorded precipitation totals exceeding 10 inches. In Santa Barbara County, San Marcos Pass recorded 10.32 inches. In Ventura County Nordoff Ridge recorded 10.04 inches and White Ledge Peak 10.87 inches. Precipitation amounts in Los Angeles County generally ranged from 1 to 3 inches, with orographically favored foothill and mountain locations receiving the higher amounts. Little rain fell in Palmdale and Lancaster because of a pronounced rain shadow effect. Downtown Los Angeles (USC) received 2.03 inches. Here's an archived copy of a NWS Los Angeles/Oxnard Public Information Statement with some rainfall totals for the storm from around the area.

A number of rainfall records for October 13 and 14 fell to the storm, including those for Paso Robles, Santa Maria, Santa Barbara Airport, WFO Oxnard, Burbank Airport, Pierce College in Woodland Hills, LAX, Santa Monica Pier, San Gabriel, and Long Beach Airport. Many of the records broken were set in 1957 and 1968 -- both El Niño years with above average rainfall at Los Angeles.

More information concerning Southern California weather can be found using our WEATHER LINKS page.

Thursday, 15 October 2009 07:39:30 (Pacific Daylight Time, UTC-07:00)  #    Disclaimer  |   | 
# Saturday, 10 October 2009

UW-MAD GOES-11 WV Satellite Image Saturday, Oct. 10, 2009 12:30 p.m. PDT Click
UW-MAD GOES-11 WV Satellite Image
Saturday, Oct. 10, 2009 12:30 p.m. PDT

An unseasonably strong Pacific storm system, primed with the remnants of Typhoon Melor, and powered by an extended Pacific jet, is expected to pound California early next week with high winds, heavy rain, and heavy snow at the higher elevations of the Sierra.

Medium range model forecasts suggest that the northern two-thirds of the state will see the highest rainfall totals, but over the last couple of days, the GFS has been trending wetter in Southern California. Significant rainfall in the Los Angeles area, and recently burned areas in the San Gabriel Mountains, appears to be a possibility. Forecast details should become more clear as we move closer to the event and into the forecast window of the high resolution models.


The Aug-Sep Multivariate ENSO Index (MEI), decreased from 0.978 to 0.754, however other El Niño signals appear to be rebounding. In the last two weeks low level equatorial westerly anomalies have increased significantly. The reduction in the strength of the trade winds, and a downwelling Kelvin wave resulting from a very strong westerly wind burst already appear to be increasing upper ocean heat content in the central equatorial Pacific. The 30 day moving Southern Oscillation Index (SOI) is still positive, but is dropping, and should return to negative territory over the next week or so.

The foci of recurring equatorial westerly wind bursts and enhanced west-central Pacific convection has been slowly migrating eastward. The most recent round of enhanced convection was centered at about 160E. This is consistent with a developing El Niño, and may have helped to extend the current Pacific jet following an East Asian mountain torque event. However, total and relative AAM remain negative, and are lower than is generally the case during a developing El Niño.

Moderate El Niños come in many flavors and have varying impacts. Under the guise of such El Niños Los Angeles experienced its second wettest water year on record in 2004-2005, when 37.25 inches of rain was recorded; then in 2006-2007 had its driest water year on record, when only 3.21" was recorded.

More information concerning Southern California weather can be found using our WEATHER LINKS page.

Saturday, 10 October 2009 07:43:02 (Pacific Daylight Time, UTC-07:00)  #    Disclaimer  |   | 
# Tuesday, 29 September 2009

GOES-11 IR Satellite Image Tuesday, Sept. 29, 2009 1:30 p.m. PDT Click
GOES-11 IR Satellite Image
Tuesday, Sept. 29, 2009 1:30 p.m. PDT

The frontal band associated with the first Pacific upper level low system and trough of Autumn 2009 is producing some showers in Central California. Some snow showers could occur at the higher elevations of the Sierra. A strong onshore flow has dramatically cooled temperatures throughout the state.

Today's cool temps are a welcome respite from several days of hot weather. Wednesday and Thursday of last week, Downtown Los Angeles (USC) recorded a high of 100°F; and Saturday, Woodland Hills (Pierce College) reported a high of 107°F. Temperatures are expected to rebound Wednesday, Thursday and Friday, but are forecast to cool again over the weekend.

Similar to what occurred in July there has been little change in equatorial Pacific SST anomalies, the Southern Oscillation Index (SOI) has switched from negative to positive, the Aug-Sep Multivariate ENSO Index (MEI) value is not expected to significantly increase, and the Global Wind Oscillation (GWO) has dropped its orbit to a lower relative AAM state.

On the plus side, a large area of enhanced convection has redeveloped in the West Central Pacific from about 150E to the dateline, and another of a series of Westerly Wind Bursts (WWB) is occurring -- the strongest observed so far during this ENSO transition. This WWB will likely be followed by another eastward propagating downwelling Kelvin wave, which could help increase upper-ocean heat content anomalies in the equatorial Pacific.

Moderate El Niños come in many flavors and have varying impacts. Under the guise of such El Niños Los Angeles experienced its second wettest water year on record in 2004-2005, when 37.25 inches of rain was recorded; then in 2006-2007 had its driest water year on record, when only 3.21" was recorded.

More information concerning Southern California weather can be found using our WEATHER LINKS page.

Tuesday, 29 September 2009 07:54:15 (Pacific Daylight Time, UTC-07:00)  #    Disclaimer  |   | 
# Thursday, 06 August 2009

Global Wind Oscillation Phase Space - May 7, 2009 vs August 4, 2009 Click
Global Wind Oscillation Phase Space
May 7, 2009 vs August 4, 2009

After spending the last week of May and most of June on the positive relative AAM (El Niño) side of the Global Wind Oscillation (GWO) phase space, the GWO slipped back into negative relative AAM territory the last week of June and stayed there most of July. Following the lead of the atmosphere, development of the current El Niño also slowed in July.

During July there was little change in equatorial Pacific SST anomalies; the Southern Oscillation Index (SOI) became strongly positive; and the June-July Multivariate ENSO Index (MEI) value, reported August 5, increased by only 0.05.

However, during July, enhanced tropical convection shifted from the western Indian Ocean to the west central Pacific, extending from about 140E to the dateline. This was followed by the development of a strong Westerly Wind Burst (WWB) in the western Pacific. Coincident with the WWB was a dramatic reduction in the SOI, and an an orbit of the GWO to a somewhat higher global relative AAM state. These events are consistent with a developing El Niño.

According to the El Niño/Southern Oscillation (ENSO) Diagnostic Discussion issued August 6 by the Climate Prediction Center/NCEP/NWS, "current conditions and model forecasts favor the continued development of a weak-to-moderate strength El Niño into the Northern Hemisphere Fall 2009, with the likelihood of at least a moderate strength El Niño (3-month Niño-3.4 SST index of +1.0°C or greater) during the Northern Hemisphere Winter 2009-10."

How often are Summer temps hotter in Seattle than the San Fernando Valley? From July 26 to August 3, 2009, the Seattle area suffered through a heat wave that broke numerous records, including several "all-time" temperature records. On July 29, 2009 Sea-Tac reached 103°F, Bellingham 96°F, and Seattle WFO (Sandpoint) 105°F, the highest temperature ever recorded at these stations.

More information concerning Southern California weather can be found using our WEATHER LINKS page.

Thursday, 06 August 2009 08:14:57 (Pacific Daylight Time, UTC-07:00)  #    Disclaimer  |   | 
# Thursday, 09 July 2009

Click for Animation Click
NOAA/NESDIS 50km Global SST Anomaly
July 3, 2008 vs July 2, 2009
Click for Animation

Los Angeles Temps Continue Below Normal.

Downtown Los Angeles (USC) ended the water year on June 30th having recorded 9.08 inches of rain, which is 6.06 inches below the 1971-2000 norm of 15.14 inches. Some additional water year rainfall totals:

Santa Barbara 10.12" 60%
Camarillo 6.61" 42%
Burbank 10.65" 61%
Palmdale 5.24" 71%
Sandberg 10.68" 85%

According to the El Nino/Southern Oscillation (ENSO) Diagnostic Discussion issued July 9 by the Climate Prediction Center/NCEP/NWS, "During June 2009, conditions across the equatorial Pacific Ocean transitioned from ENSO-neutral to El Niño conditions." According to the report, El Nino conditions are expected to continue to develop, and last through the NH Winter.

The May-June Multivariate ENSO Index (MEI) value, reported July 6, has increased by 0.51 to +0.85. As was the case last month, the 3-month rise of the MEI (since February-March) is the 4th highest on record for this time of year, and was last exceeded by the strong El Niño of 1997. According to the MEI's originator, Dr. Klaus Wolter, "the combination of already border-line moderate El Niño conditions along with such a big rise in the MEI at this time of year has always been followed by continued El Niño conditions through the remainder of the calendar year, at least in the modern MEI record (since 1950)."

However, as the truncated 2006-07 El Niño event demonstrates, an El Niño is more than just warm Pacific equatorial SSTs. Through complex forcing and feedback mechanisms, the atmosphere and oceans have to cooperate on a global scale. As climate scientist Ed Berry cautions in his July 3rd Atmospheric Insights post, "Should total AAM departures become comparable to that observed during this past January and February, my concerns of an El-Nino 'false alarm' for the weather-climate dynamical system will be significantly raised."

Generally speaking, the momentum of the atmosphere increases when there is an El Niño, and decreases during a La Niña. Over the past 40 days the Global Wind Oscillation (GWO) has retreated from the higher AAM (El Niño) side of the GWO phase space to the lower AAM (La Niña) side. One concern is that two areas of tropical forcing (Indian Ocean and Pacific) may interact in such a way as to quash the El Niño engine. We'll see!

Closer to home, although temps in Southern California have recently been more seasonable, particularly in the Valleys, the last time the average daily temperature in Downtown Los Angeles was above normal was back on May 21 -- 48 days ago.

More information concerning Southern California weather can be found using our WEATHER LINKS page.

Thursday, 09 July 2009 08:20:43 (Pacific Daylight Time, UTC-07:00)  #    Disclaimer  |   | 
# Saturday, 06 June 2009

NRL GOES Visible/IR Satellite Image June 5, 2009 8:00 a.m. PDT Click
NRL GOES Visible/IR Satellite Image
June 5, 2009 8:00 a.m. PDT

Instability and moisture associated with a very late season upper level low produced more rain in Southern California Friday, setting a record for June rainfall at Santa Barbara Airport.

Downtown Los Angeles (USC) recorded a total of 0.13 inch of rain Friday. The rainfall increased the water year precipitation total for Los Angeles to 9.08 inches, which is 6.05 inches below normal. Santa Barbara Airport recorded 0.51 inch, setting not only a new record for the date, but for any day in June, as well as for the total amount of rain in June. Here's an archived copy of a NWS Public Information Statement with some preliminary rainfall totals from around the area as of 5:00 p.m. Friday.

The April-May Multivariate ENSO Index (MEI) value (released today) has increased by 0.54 to +0.34. As discussed by MEI originator, Klaus Wolter, the 3-month rise of the MEI since January-February is the 4th highest on record for this time of year, exceeded last by the strong Niño of 1997. According to Dr. Wolter, if next month's MEI rank is at least the same as this month (37th), "it would be unprecedented for it to drop below that high-neutral ENSO-phase range by the end of 2009, virtually excluding a return to La Niña, based on the MEI record since 1950." We'll see!

More information concerning Southern California weather can be found using our WEATHER LINKS page.

Saturday, 06 June 2009 08:24:30 (Pacific Daylight Time, UTC-07:00)  #    Disclaimer  |   | 
# Thursday, 04 June 2009

Aqua Modis Satellite Image June 3, 2009 2:15 p.m. PDT Click
Aqua Modis Satellite Image
June 3, 2009 2:15 p.m. PDT

Unusual weather for June. Not so much that there were thunderstorms, but that the thunderstorms were in part the result of an unseasonably strong jet embedded in the base of an offshore upper level low.

It's a bit of a stretch, but an argument could be made that these storms were a calling card of an increasingly energetic atmosphere, and a developing El Niño.

Downtown Los Angeles (USC) recorded a total of 0.02 inch of rain Wednesday. The rainfall increased the water year precipitation total for Los Angeles to 8.95 inches, which is 6.16 inches below normal.

It's not often that a trace of rainfall sets a record, but that was the case at Camarillo Airport and Palmdale, which had not previously recorded precipitation on June 3. The 0.03 inches recorded at Sandberg was also a record. Here's a CNRFC graphic with some 24 hour rainfall totals in Los Angeles County.

Several factors point to an increased probability of El Niño conditions developing over the next few months. Among them, Equatorial Pacific SSTs have increased, and the subsurface heat content is the highest it's been since the El Niño of 2006-07.

But as the short-lived 2006-07 El Niño event demonstrates, an El Niño is more than just warm Pacific equatorial SSTs. Through complex forcing and feedback mechanisms, the atmosphere and oceans have to cooperate on a global scale. Generally speaking the momentum of the atmosphere increases when there is an El Niño, and decreases during a La Nina.

And it looks like the atmospheric momentum may be increasing. Orbits of the Global Wind Oscillation (GWO), a measure of atmospheric momentum, have been shifting upward, in the direction of more energetic values usually associated with an El Niño.

However, an El Niño is not a done deal. The climate system is just leaning in that direction. As climate scientist Klaus Wolter has previously pointed out, in a similar situation in 1973-1975, the climate fell back into a La Niña for another year. But at this point it appears we may be diverging from that analog case. (See June 6 Weathernotes.) We'll see!

Update 06/05/09. Unseasonably strong 110+ kt jet overhead as upper low center moves onshore in Central California. At 7:15 this morning, Intellicast composite radar showed most of the shower activity occurring to the north of Los Angeles, but there has been scattered showers in the Los Angeles area as well, with measurable rain recorded at a number of stations. Here's an archived copy of a NWS Public Information Statement with some preliminary rainfall totals as of 5:00 p.m.

More information concerning Southern California weather can be found using our WEATHER LINKS page.

Thursday, 04 June 2009 08:28:22 (Pacific Daylight Time, UTC-07:00)  #    Disclaimer  |   |