# Thursday, July 9, 2020
Downtown Los Angeles (USC)
November 2019-April 2020 Rain
Month Precip
in.
Normal
in.
Percent of Normal 500mb
Height
Anomaly
November 2.12 1.04 204%
December 4.84 2.33 208%
January 0.32 3.12 10%
February 0.04 3.80 1%
March 4.35 2.43 179%
April 3.02 0.91 332%
Rain Year 14.86 14.93 99.5%  

To say Los Angeles recorded a normal amount of rainfall during a rain year is not the same as saying the rain year was typical. As I scan down the monthly precipitation totals in Los Angeles' 143 year weather record, it seems the pattern of rainfall is different for every one.

Our most recent rain year, 2019-2020, is an excellent example. Wet weather in November and December was followed by equally dry weather in January and February. Just when it looked like the rain season was done, wet weather returned in March and April. The end product was a "normal" rain year, with 14.86 inches of precipitation recorded at Downtown Los Angeles (USC) from July 1, 2019 to June 30, 2020..

As can be seen from the mean monthly 500mb height anomalies, much of this rain season's precipitation resulted from a semi-persistent pattern of upper-level low pressure off the coast of Southern California. The pattern of precipitation in the West for the rain year reflects the position of these lows.

Based on the CPC's Oceanic Nino Index (ONI), equatorial Pacific SSTs marginally capable of supporting El Nino conditions developed in the Oct-Nov-Dec 2019 season, but ocean-atmosphere coupling characteristic of El Nino did not follow.

There is some evidence that suggests Southern California precipitation is more closely correlated with AAM than with Nino 3.4 SST. Here is an extended GWO phase space plot for November 2019 - May 2020. The November-March GWO Phase Plots for ONI-based warm episodes can be found on our El Nino Comparison Chart for 2019-2020 page.

More information about Southern California weather and climate can be found using our WEATHER LINKS page.

Thursday, July 9, 2020 3:55:10 PM (Pacific Daylight Time, UTC-07:00)  #    Disclaimer  |   | 
# Saturday, April 4, 2020

The following chart compares various climate parameters for warm ENSO episodes that have occurred since 1950. The warm episodes are based on the revised Oceanic Niño Index (ONI) which is calculated using the three month running mean of ERSST.v5 SST anomalies in the Niño 3.4 region with multiple-centered 30 year base periods. Unless noted the warm episodes are those specified in the CPC's tabulation of Cold & Warm Episodes by Season. A description of the parameters follows the chart. With the exception of years prior to 1957, a Nov-Mar GWO phase space plot is included for each warm episode.

Year Jul-Sep
AAM
Nov-Mar
AAM
Peak MEI Peak MEI Season Peak
ONI
Peak ONI Season L.A. Rain GWO
Phase Plot
1951-521 -- -- 0.82 JULAUG 1.2 SON 26.21 --
1952-532 -- -- 0.76 APRMAY 0.8 AMJ-MJJ 9.46 --
1953-542 -- -- 0.48 AUGSEP 0.8 SON-DJF 11.99 --
1957-583,4 -- 0.78 1.47 DECJAN, JANFEB 1.8 DJF 21.13 Click for Nov-Mar GWO Phase Space Plot
1958-594 -0.92 -0.21 0.81 JANFEB 0.6 NDJ, DJF, JFM 5.58 Click for Nov-Mar GWO Phase Space Plot
1963-64 0.01 0.05 0.88 OCTNOV, DECJAN 1.4 OND 7.93 Click for Nov-Mar GWO Phase Space Plot
1965-66 -0.83 -0.75 1.43 JULAUG 2.0 SON, OND 20.44 Click for Nov-Mar GWO Phase Space Plot
1968-69 0.13 0.51 0.85 JANFEB 1.1 DJF, JFM 27.47 Click for Nov-Mar GWO Phase Space Plot
1969-70 0.36 0.41 0.66 OCTNOV 0.9 SON 7.77 Click for Nov-Mar GWO Phase Space Plot
1972-73 -0.10 -0.24 1.83 JUNJUL, JULAUG 2.1 OND, NDJ 21.26 Click for Nov-Mar GWO Phase Space Plot
1976-77 0.29 -0.83 1.02 AUGSEP 0.9 OND 12.31 Click for Nov-Mar GWO Phase Space Plot
1977-78 -0.65 1.01 0.97 SEPOCT, OCTNOV 0.8 OND, NDJ 33.44 Click for Nov-Mar GWO Phase Space Plot
1979-80 0.49 -0.01 0.7, 0.6 ND, MA-JJ 0.6 NDJ, DJF 26.98 Click for Nov-Mar GWO Phase Space Plot
1982-83 0.94 2.34 2.9 AM 2.2 OND,NDJ, DJF 31.25 Click for Nov-Mar GWO Phase Space Plot
1986-875 0.23 0.02 2.0 MJ87 1.2 NDJ,-JFM 7.66 Click for Nov-Mar GWO Phase Space Plot
1987-885 1.16 1.00 2.0 MJ87 1.7 JAS 12.48 Click for Nov-Mar GWO Phase Space Plot
1991-92 -0.01 0.81 2.0 MA92 1.7 DJF 21.00 Click for Nov-Mar GWO Phase Space Plot
1994-95 -0.42 0.77 1.5 SO 1.1 NDJ 24.35 Click for Nov-Mar GWO Phase Space Plot
1997-98 1.82 1.49 2.3, 2.6 MJ97, MA98 2.4 OND, NDJ 31.01 Click for Nov-Mar GWO Phase Space Plot
2002-03 0.05 0.32 1.0, 0.9 JA, ND 1.3 OND 16.49 Click for Nov-Mar GWO Phase Space Plot
2004-05 -0.02 0.75 0.7, 0.8 JA04, FM05 0.7 ASO-NDJ 37.25 Click for Nov-Mar GWO Phase Space Plot
2006-07 0.14 -0.32 0.9 ON 0.9 OND-NDJ 3.21 Click for Nov-Mar GWO Phase Space Plot
2009-10 -0.10 0.30 1.1, 1.3 ON, JF-FM 1.6 NDJ 16.36 Click for Nov-Mar GWO Phase Space Plot
2014-156 -0.52 -0.29 2.2 AS15 1.2 MJJ 8.52 Click for Nov-Mar GWO Phase Space Plot
2015-166 1.34 1.64  2.2 AS15 2.6 NDJ 9.36 Click for Nov-Mar GWO Phase Space Plot
2018-19 -0.43 1.22 0.5, 0.8 AS18, FM19 0.9 OND 18.82 Click for Nov-Mar GWO Phase Space Plot
2019-207.8 -1.12 0.44 0.5 ON 0.6 JFM 14.86 Click for Nov-Mar GWO Phase Space Plot

1. AAM and AAM tendency anomaly data for 1951-52 not available.
2. Continuous warm episode from JFM 1953 to JFM 1954.
3. AAM anomaly is average for Jan-Mar 1958.
4. Continuous warm episode from MAM 1957 to JJA 1958 & OND 1958 to FMA 1959.
5. Continuous warm episode from ASO 1986 to JFM 1988.
6. Continuous warm episode from OND 2014 to AMJ 2016.
7. Marginally qualifies as ONI-based Warm Episode.
8. Data as of July 6, 2020.

Jul-Sep AAM & Nov-Mar AAM: The mean of the global relative atmospheric angular momentum anomaly for the periods July 1 to September 30 amd November 1 to March 31 of the following year. GWO phase space data is calculated using code from the Global Synoptic Dynamic Model page of the PSD Map Room Climate Products. Reference Weickmann and Berry, 2008.

Peak MEI: The peak seasonal value of the Multivariate ENSO Index (MEI). MEI values are v2 starting with 1979-80. MEI v1 values were last updated December 2018.

Peak MEI Season: The peak bi-monthly season(s) for which the MEI is computed.

Peak ONI: The peak Oceanic Niño Index (ONI) based on SST anomalies in the Niño 3.4 region. Reference Climate Prediction Center Cold & Warm Episodes by Season (Multiple centered 30-year base periods.)

Peak ONI Season: The peak tri-monthly season(s) for which the ONI is computed.

L.A. Rain: The July-June rainfall year precipitation total in inches for Downtown Los Angeles (USC). Reference WRCC LOS ANGELES DWTN USC CAMPUS, CA.

GWO Phase Space Plot: Plot of global relative atmospheric angular momentum anomaly vs. global relative atmospheric angular momentum tendency anomaly for the period November 1 to March 31 of the following year. Data is calculated using code from the Global Synoptic Dynamic Model page of the PSD Map Room Climate Products. Reference Weickmann and Berry, 2008.

Saturday, April 4, 2020 2:55:23 PM (Pacific Standard Time, UTC-08:00)  #    Disclaimer  |   | 
# Friday, July 5, 2019

WRCC/HPRCC Percent of Normal Precipitation, July 1, 2018 to June 30 2019 Click
WRCC/HPRCC Percent of Normal Precipitation
July 1, 2018 to June 30 2019

Downtown Los Angeles (USC) ended the 2018-19 rain year (July 1 to June 30) with 18.82 inches of rain. This is about 126% of the normal yearly precipitation total of 14.93 inches. Much of the southwest recorded average to above average precipitation, thanks to a generally progressive pattern in the West and a strong Pacific jet this Winter.

Based on the CPC's Oceanic Nino Index (ONI), equatorial Pacific SSTs capable of supporting El Nino conditions developed in the Sep-Oct-Nov 2108 season, but ocean-atmosphere coupling characteristic of El Nino did not develop until January 2019.

Although this year's El Nino was weak and somewhat atypical, it should be noted that the Global Wind Oscillation orbited through positive AAM phases from mid October until just recently. Historically, continually positive AAM anomaly values during the Nov-Mar period have occurred during strong El Ninos, such as in 1997-98 and 1982-83. The Nov-Dec GWO Phase Plots for ONI-based warm episodes can be found on our El Nino Comparison Chart for 2018-2019 page.

There is some evidence that suggests Southern California precipitation is more closely correlated with AAM than with Nino 3.4 SST.

More information about Southern California weather and climate can be found using our WEATHER LINKS page.

Friday, July 5, 2019 9:33:29 AM (Pacific Daylight Time, UTC-07:00)  #    Disclaimer  |   | 
# Monday, April 15, 2019

The following chart compares various climate parameters for warm ENSO episodes that have occurred since 1950. The warm episodes are based on the revised Oceanic Niño Index (ONI) which is calculated using the three month running mean of ERSST.v5 SST anomalies in the Niño 3.4 region with multiple-centered 30 year base periods. Unless noted the warm episodes are those specified in the CPC's tabulation of Cold & Warm Episodes by Season. A description of the parameters follows the chart. With the exception of years prior to 1957, a Nov-Mar GWO phase space plot is included for each warm episode.

Year Jul-Sep
AAM
Nov-Mar
AAM
Peak MEI Peak MEI Season Peak
ONI
Peak ONI Season L.A. Rain GWO
Phase Plot
1951-521 -- -- 0.82 JULAUG 1.2 SON 26.21 --
1952-532 -- -- 0.76 APRMAY 0.8 AMJ-MJJ 9.46 --
1953-542 -- -- 0.48 AUGSEP 0.8 SON-DJF 11.99 --
1957-583,4 -- 0.78 1.47 DECJAN, JANFEB 1.8 DJF 21.13 Click for Nov-Mar GWO Phase Space Plot
1958-594 -0.92 -0.21 0.81 JANFEB 0.6 NDJ, DJF, JFM 5.58 Click for Nov-Mar GWO Phase Space Plot
1963-64 0.01 0.05 0.88 OCTNOV, DECJAN 1.4 OND 7.93 Click for Nov-Mar GWO Phase Space Plot
1965-66 -0.83 -0.75 1.43 JULAUG 2.0 SON, OND 20.44 Click for Nov-Mar GWO Phase Space Plot
1968-69 0.13 0.51 0.85 JANFEB 1.1 DJF, JFM 27.47 Click for Nov-Mar GWO Phase Space Plot
1969-70 0.36 0.41 0.66 OCTNOV 0.9 SON 7.77 Click for Nov-Mar GWO Phase Space Plot
1972-73 -0.10 -0.24 1.83 JUNJUL, JULAUG 2.1 OND, NDJ 21.26 Click for Nov-Mar GWO Phase Space Plot
1976-77 0.29 -0.83 1.02 AUGSEP 0.9 OND 12.31 Click for Nov-Mar GWO Phase Space Plot
1977-78 -0.65 1.01 0.97 SEPOCT, OCTNOV 0.8 OND, NDJ 33.44 Click for Nov-Mar GWO Phase Space Plot
1979-80 0.49 -0.01 0.6 ND, MA, MJ 0.6 NDJ, DJF 26.98 Click for Nov-Mar GWO Phase Space Plot
1982-83 0.94 2.34 2.9 AM 2.2 OND,NDJ, DJF 31.25 Click for Nov-Mar GWO Phase Space Plot
1986-875 0.23 0.02 2.0 MJ87 1.2 NDJ,-JFM 7.66 Click for Nov-Mar GWO Phase Space Plot
1987-885 1.16 1.00 2.0 MJ87 1.7 JAS 12.48 Click for Nov-Mar GWO Phase Space Plot
1991-92 -0.01 0.81 2.0 MA 1.7 DJF 21.00 Click for Nov-Mar GWO Phase Space Plot
1994-95 -0.42 0.77 1.4 SO 1.1 NDJ 24.35 Click for Nov-Mar GWO Phase Space Plot
1997-98 1.82 1.49 2.3, 2.6 MJ97, MA98 2.4 OND, NDJ 31.01 Click for Nov-Mar GWO Phase Space Plot
2002-03 0.05 0.32 1.0, 0.9 JA, ND 1.3 OND 16.49 Click for Nov-Mar GWO Phase Space Plot
2004-05 -0.02 0.75 0.7, 0.8 JA04, FM05 0.7 ASO-NDJ 37.25 Click for Nov-Mar GWO Phase Space Plot
2006-07 0.14 -0.32 0.9 ON 0.9 OND-NDJ 3.21 Click for Nov-Mar GWO Phase Space Plot
2009-10 -0.10 0.30 1.1, 1.3 ON, JF-FM 1.6 NDJ 16.36 Click for Nov-Mar GWO Phase Space Plot
2014-156 -0.52 -0.29 2.2 AS15 1.2 MJJ 8.52 Click for Nov-Mar GWO Phase Space Plot
2015-166 1.34 1.64  2.2 AS15 2.6 NDJ 9.36 Click for Nov-Mar GWO Phase Space Plot
2018-197 -0.43 1.22 0.5, 0.8 AS18, FM19 0.9 OND 17.99 Click for Nov-Mar GWO Phase Space Plot

1. AAM and AAM tendency anomaly data for 1951-52 not available.
2. Continuous warm episode from JFM 1953 to JFM 1954.
3. AAM anomaly is average for Jan-Mar 1958.
4. Continuous warm episode from MAM 1957 to JJA 1958 & OND 1958 to FMA 1959.
5. Continuous warm episode from ASO 1986 to JFM 1988.
6. Continuous warm episode from OND 2014 to AMJ 2016.
7. Data as of March 31, 2019.

Jul-Sep AAM & Nov-Mar AAM: The mean of the global relative atmospheric angular momentum anomaly for the periods July 1 to September 30 amd November 1 to March 31 of the following year. GWO phase space data is calculated using code from the Global Synoptic Dynamic Model page of the PSD Map Room Climate Products. Reference Weickmann and Berry, 2008.

Peak MEI: The peak seasonal value of the Multivariate ENSO Index (MEI). MEI values are v2 starting with 1979-80. MEI v1 values were last updated December 2018.

Peak MEI Season: The peak bi-monthly season(s) for which the MEI is computed.

Peak ONI: The peak Oceanic Niño Index (ONI) based on SST anomalies in the Niño 3.4 region. Reference Climate Prediction Center Cold & Warm Episodes by Season (Multiple centered 30-year base periods.)

Peak ONI Season: The peak tri-monthly season(s) for which the ONI is computed.

L.A. Rain: The July-June rainfall year precipitation total in inches for Downtown Los Angeles (USC). Reference WRCC LOS ANGELES DWTN USC CAMPUS, CA. See Precipitation>Quantity>Monthly Precipitation Listings>Monthly Totals.

GWO Phase Space Plot: Plot of global relative atmospheric angular momentum anomaly vs. global relative atmospheric angular momentum tendency anomaly for the period November 1 to March 31 of the following year. Data is calculated using code from the Global Synoptic Dynamic Model page of the PSD Map Room Climate Products. Reference Weickmann and Berry, 2008.

Monday, April 15, 2019 10:49:50 AM (Pacific Daylight Time, UTC-07:00)  #    Disclaimer  |   | 
# Friday, August 31, 2018

Color-coded Los Angeles (KCQT) Precipitation - July 1877 to June 2018
Color-coded Los Angeles (KCQT) Precipitation
July 1877 to June 2018

The graphic above is color-coded chart of Los Angeles (KCQT) rain year precipitation from 1877 to 2017, a period of 141 years. Years progress from left to right. The rain year is from July 1 of the indicated year to June 30 of the following year. Colors are indicative of the following amounts of rain:

Red: VERY DRY - less than 5 inches of rain.
Orange: DRY - more than 5 inches of rain, but less than 13 inches.
Light blue: ABOUT AVERAGE - more than 13 inches of rain, but less than 17 inches.
Blue: WET - more than 17 inches of rain, but less than 22 inches.
Dark Blue: VERY WET - more than 22 inches of rain.

Following are some observations regarding Los Angeles rainfall:

- VERY DRY and DRY years (orange & red) have been more common than VERY WET and WET years (blue & dark blue). In the first 70 years there were a few more dry years than wet years (30 vs. 25). In the last 70 years there have been about twice as many dry years as wet years (41 vs 20).

- Extended dry periods (orange & red) have been more common than extended wet periods (blue & dark blue) and generally last longer. The longest uninterrupted dry period is 7 years, while the longest wet period is only 3 years. If we allow for one interceding year, the longest dry period is 11 years and the longest wet period is 5 years.

- There were no VERY DRY years (red) prior to 1960 and three of the four VERY DRY years have occurred since 2001.

- ABOUT AVERAGE years (light blue) have not been common. Only 24 of 141 years (17%) have had ABOUT AVERAGE rainfall. The first 70 years had 15 ABOUT AVERAGE years and the last 70 years had 9 ABOUT AVERAGE years.

- Overall, VERY WET years (dark blue) have been more common than VERY DRY years (red), but in the last 30 years the number of VERY WET years (4) and VERY DRY years (3) have been about equal.

- Consecutive VERY WET (dark blue) or VERY DRY years (red) have been rare. There has been one instance of back-to-back VERY WET years (1956 & 1957) and no instances of back-to-back VERY DRY years.

Here is a PDF of the rainfall chart. The chart includes the January - December precipitation amounts for each year, as well as the rain year value.

More information about Southern California weather and climate can be found using our WEATHER LINKS page.

Friday, August 31, 2018 8:28:18 AM (Pacific Daylight Time, UTC-07:00)  #    Disclaimer  |   | 
# Monday, July 2, 2018

TAO/TRITON Five-Day SST - July 2016 to June 2018 Click
TAO/TRITON Five-Day SST
July 2016 to June 2018

Downtown Los Angeles (USC) has ended the 2017-18 rain year (July 1 to June 30) with only 4.79 inches of rain. That makes 2017-18 the third driest rain year since recordkeeping began in July 1877. The rainfall total was only 32% of normal and is less rain than was recorded during any rain year in our recent five year drought. The three driest rain years in Los Angeles have all occurred since 2001.

The June 2018 EL NIÑO/SOUTHERN OSCILLATION (ENSO) DIAGNOSTIC DISCUSSION says El Nino conditions are favored to develop during the Northern Hemisphere fall, and and this is the most likely ENSO state to be present this winter. According to the CPC/IRI consensus forecast there is a 50% chance of El Nino conditions developing this fall, with the probability increasing to about 65% this winter.

Keeping in mind last year's "failed" El Nino, the April-May value of the Multivariate ENSO Index (MEI) increased 0.9 SD to 0.47. This is just below the threshold of a weak El Niño ranking. Klaus Wolter's empirical analysis using historical analogues suggests that, compared to last month, the odds for the development of El Niño conditions later this year have dramatically increased.

If Los Angeles rain year precipitation is averaged for El Nino episodes (CPC ERSSTv5) since 1950, the average is about 120% of normal. However, El Nino conditions do not guarantee above average rainfall, particularly in the last 15 years or so. The driest rain year on record in Los Angeles (2006-07) was during an El Nino; and two rain years (2014-15 & 2015-16) of our recent five year drought were during an El Nino.

More information about Southern California weather and climate can be found using our WEATHER LINKS page.

Monday, July 2, 2018 10:58:36 AM (Pacific Daylight Time, UTC-07:00)  #    Disclaimer  |   | 
# Tuesday, November 21, 2017

The following chart compares various climate parameters for cold ENSO episodes that have occurred since 1949. Except where noted the cold episodes listed are those specified in the CPC's tabulation of Cold & Warm Episodes by Season. The cold and warm episodes are based on the Oceanic Niño Index (ONI), which is calculated using the three month running mean of ERSST.v5 SST anomalies in the Niño 3.4 region with multiple-centered 30 year base periods. A description of the parameters follows the chart. With the exception of years prior to 1957, a Nov-Mar GWO phase space plot is included for each episode. Data for 2017-18 will be updated periodically.

Year ERSST
Version
Nov-Mar
AAM
Peak MEI4 Peak MEI Season Peak
ONI
Peak ONI Season L.A. Rain GWO
Phase Plot
1949-501,2 v5 -- -1.445 APRMAY -1.5 DJF 9.94 --
1950-511,3 v4 -- -1.235 NOVDEC -0.8 NDJ, DJF 8.21 --
1954-551 v5 -- -1.528 MAYJUN (54) -0.9 ASO 11.94 --
1955-561 v5 -- -2.209 MAYJUN (55) -1.7 OND 16.00 --
1956-571 v3b -- -1.490 MAYJUN (56) -0.4 Several 9.54 --
1961-62 v2 -0.515 -1.065 DECJAN -0.3 ASO, SON 18.79 Click for Nov-Mar GWO Phase Space Plot
1962-63 v3b -1.264 -0.837 JANFEB -0.4 OND, NDJ 8.38 Click for Nov-Mar GWO Phase Space Plot
1964-65 v5 -1.150 -1.476 JULAUG -0.8 ASO - DJF 13.69 Click for Nov-Mar GWO Phase Space Plot
1967-683 v4 -0.773 -1.106 APRMAY -0.7 JFM 16.58 Click for Nov-Mar GWO Phase Space Plot
1970-71 v5 -0.980 -1.870 MARAPR -1.4 DJF, JFM 12.32 Click for Nov-Mar GWO Phase Space Plot
1971-72 v5 -0.174 -1.439 AUGSEP -1.0 OND 7.17 Click for Nov-Mar GWO Phase Space Plot
1973-74 v5 -1.336 -1.912 DECJAN -2.0 NDJ 14.92 Click for Nov-Mar GWO Phase Space Plot
1974-75 v5 -0.846 -1.230 OCTNOV -0.8 OND 14.35 Click for Nov-Mar GWO Phase Space Plot
1975-76 v5 -0.716 -1.968 SEPOCT -1.7 OND, NDJ 7.22 Click for Nov-Mar GWO Phase Space Plot
1983-84 v5 -1.099 -0.509 JANFEB -1.0 OND 10.43 Click for Nov-Mar GWO Phase Space Plot
1984-85 v5 -0.600 -0.715 APRMAY -1.1 NDJ 12.82 Click for Nov-Mar GWO Phase Space Plot
1988-89 v5 -1.144 -1.501 AUGSEP -1.8 OND, NDJ 8.08 Click for Nov-Mar GWO Phase Space Plot
1995-96 v5 -0.227 -0.597 DECJAN -1.0 SON - NDJ 12.46 Click for Nov-Mar GWO Phase Space Plot
1998-99 v5 -0.544 -1.123 JANFEB -1.6 NDJ, DJF 9.09 Click for Nov-Mar GWO Phase Space Plot
1999-00 v5 -0.784 -1.189 JANFEB -1.7 NDJ, DJF 11.57 Click for Nov-Mar GWO Phase Space Plot
2000-01 v5 -0.801 -.701 OCTNOV -0.7 OND - DJF 17.94 Click for Nov-Mar GWO Phase Space Plot
2005-06 v5 -0.616 -0.575 MARAPR -0.8 NDJ, DJF 13.19 Click for Nov-Mar GWO Phase Space Plot
2007-08 v5 -1.015 -1.579 FEBMAR -1.6 NDJ - DJF 13.53 Click for Nov-Mar GWO Phase Space Plot
2008-09 v5 -0.599 -.723 FEBMAR -0.8 DJF 9.08 Click for Nov-Mar GWO Phase Space Plot
2010-11 v5 -0.598 -1.888 AUGSEP -1.7 SON, OND 20.20 Click for Nov-Mar GWO Phase Space Plot
2011-12 v5 -0.371 -0.980 DECJAN -1.1 SON, OND 8.69 Click for Nov-Mar GWO Phase Space Plot
2016-17 v5 0.088 -0.363 SEPOCT -0.7 ASO - OND 19.00 Click for Nov-Mar GWO Phase Space Plot
2017-185 v5 -0.550 -0.731 JANFEB -1.0 NDJ 4.68 Click for Nov-Mar GWO Phase Space Plot
1. AAM and AAM tendency anomaly data not available.
2. Based on ONI values beginning with DJF 1949-50.
3. ONI did not meet threshold of 5 consecutive overlapping seasons using ERSST v5.
4. MEI values are normalized and may change as new data is added. Specified values were current as of March 6, 2018.
5. Data as of March 31, 2018.

ERSST Version: The most recent ERSST version for which the episode was designated a cold episode. (See Peak ONI below.)

Nov-Mar AAM: The mean of the global relative atmospheric angular momentum anomaly for the period November 1 to March 31 of the following year. GWO phase space data is calculated using code from the Global Synoptic Dynamic Model page of the PSD Map Room Climate Products. Reference Weickmann and Berry, 2008.

Peak MEI: The peak seasonal value of the Multivariate ENSO Index (MEI). Reference Wolter and Timlin, 1993, 1998. MEI values are normalized and may shift as new data is added.

Peak MEI Season: The peak bi-monthly season(s) for which the MEI is computed.

Peak ONI: The peak Oceanic Niño Index (ONI) based on SST anomalies in the Niño 3.4 region. Reference Climate Prediction Center Cold & Warm Episodes by Season (Multiple centered 30-year base periods.)

Peak ONI Season: The peak tri-monthly season(s) for which the ONI is computed.

L.A. Rain: The July-June rainfall year precipitation total in inches for Downtown Los Angeles (USC). Reference WRCC LOS ANGELES DWTN USC CAMPUS, CA. See Precipitation>Quantity>Monthly Precipitation Listings>Monthly Totals.

GWO Phase Space Plot: Plot of global relative atmospheric angular momentum anomaly vs. global relative atmospheric angular momentum tendency anomaly for the period November 1 to March 31 of the following year. Data is calculated using code from the Global Synoptic Dynamic Model page of the PSD Map Room Climate Products. Reference Weickmann and Berry, 2008.

Tuesday, November 21, 2017 2:00:44 PM (Pacific Standard Time, UTC-08:00)  #    Disclaimer  |   | 
# Friday, June 30, 2017

TAO/TRITON Five-Day SST - June 2015 to June 2017 Click
TAO/TRITON Five-Day SST
June 2015 to June 2017

Downtown Los Angeles (USC) finished the 2016-17 rainfall year (July 1 to June 30) with 19.00 inches of recorded precipitation. This is about 127% of the 1981-2010 normal of 14.93 inches. This was the first rain year with above normal precipitation at Los Angeles since 2009-2010, when 20.2 inches was recorded.

As of May 2017 the Pacific Decadal Oscillation Index has been positive (warm) since January 2014 -- a record 41 consecutive months. The previous record streak was 36 months, from August 1991 to July 1994.

Most climate outlooks are projecting ENSO Neutral conditions are favored to persist into the Northern Hemisphere fall, with a lesser chance of weak El Nino conditions developing over that period. Perhaps supporting the notion of El Nino development, the April-May value of the Multivariate ENSO Index (MEI) increased by 0.69 standard deviations from 0.77 to 1.46. This is solidly within the index's El Nino ranking and at the threshold of a strong El Niño ranking. According to Klaus Wolter, the increase over the last three months is the second largest on record for this time of year, exceeded only by 1997. We'll see if ENSO conditions remain neutral or some form of ENSO warming (Central Pacific?) takes place.

More information about Southern California weather and climate can be found using our WEATHER LINKS page.

Friday, June 30, 2017 6:44:36 PM (Pacific Daylight Time, UTC-07:00)  #    Disclaimer  |   | 
# Tuesday, January 24, 2017

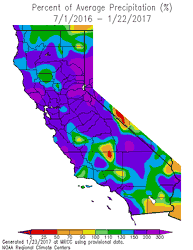
California Percent of Normal Precipitation for July 1 to January 22, 2017 (WRCC) Click
California Percent of Normal Precipitation (WRCC)
July 1, 2016 to January 22, 2017

Update on February 2, 2017. Downtown Los Angeles has ended January 2017 with 8.38 inches of rain. This is 269% of the normal January rainfall total of 3.12 inches. The preliminary Rain Year precipitation total for Downtown Los Angeles for July 1 through January 31, 2017 is 14.33 inches, which is 193% of the normal amount of 7.44 inches. Here is an updated California Percent of Normal Precipitation map from the Western Regional Climate Center for July 1, 2016 to January 31, 2017.

On the heels of a wet December, a series of Pacific storms have resulted in the wettest start to the Rain Year (July 1 - June 30) and Water Year (October 1 to September 30) since the very wet year of 2004-2005.

The six day period from January 18-23 was particularly wet, with three storms producing a total of 5.53 inches of rain at Downtown Los Angeles (USC). Here are some preliminary 7-day precipitation totals from around the area from the Ventura County Watershed Protection District.

The last system of the series, which brought very heavy precipitation to the area on Sunday, was associated with a well-defined atmospheric river. Precipitation totals in the Los Angeles area for the storm generally ranged from about 2 to 5 inches. According to the NWS, new rainfall records for January 23 were set at Los Angeles Airport (2.94 inches), Camarillo (2.74 inches) and Long Beach Airport (3.97 inches). The rainfall at Long Beach Airport was the most ever recorded in a day at that location. Here are some precipitation totals from around the area compiled by the NWS Los Angeles/Oxnard and NWS San Diego.

As of yesterday Downtown Los Angeles (USC) has recorded 14.33 inches of rain for the Rain Year. This is 217% of the normal amount of 6.65 inches for the date, and 97% of the normal amount of rainfall for an entire year. Assuming we don't get any more rain this January, the 8.38 inches recorded will work out to 269% of the normal amount for the month.

The California Cooperative Snow Surveys Snow Water Equivalents report for today puts the snowpack for the date at an average 197% of normal. That's two times the normal amount.

A little precipitation has crept back into the GFS, GEFS and ECMWF forecasts for the Los Angeles area the first week of February. We'll see!

More information about Southern California weather and climate can be found using our WEATHER LINKS page.

Tuesday, January 24, 2017 7:10:12 PM (Pacific Standard Time, UTC-08:00)  #    Disclaimer  |   | 
# Tuesday, December 27, 2016

California Percent of Normal Precipitation for July 1 to December 26, 2016 (WRCC) Click
California Percent of Normal Precipitation (WRCC)
July 1, 2016 to December 26, 2016

As of today Downtown Los Angeles (USC) December rainfall is 1.75 inches above the monthly normal of 2.33 inches. Not since the beginning of the drought has Los Angeles experienced such a wet December. The 4.08 inches of rain recorded so far this month is the most since December 2010 and the most for any month since January 2010.

Since the Rain Year began July 1, 5.48 inches of rain has fallen at Downtown Los Angeles (USC). This is more than an inch above the normal July-December rainfall of 4.32 inches. It is the best start to the Rain Year (Jul 1-Jun 30) and Water Year (Oct 1-Sep 30) since 2010.

While the rain is good news, this graphic from the Western Regional Climate Center shows that the Jul-Dec precipitation in some areas of Southern California is still below normal.

Forecasting how the cut off upper level low currently spinning offshore southwest of Los Angeles and a developing upstream trough interact is a tough task, even for a supercomputer. The trough is expected to propel the low in our general direction and then replace/absorb it. Add to the mix the possibility of pulling up some sub-tropical moisture (or not) and the forecast becomes even trickier. Guess we'll see!

More information about Southern California weather and climate can be found using our WEATHER LINKS page.

Tuesday, December 27, 2016 3:50:30 PM (Pacific Standard Time, UTC-08:00)  #    Disclaimer  |   | 
# Saturday, July 2, 2016

Dying Redwoods Malibu Creek State Park Click
Dead and Dying Coast Redwoods Along Century Lake
Malibu Creek State Park

Downtown Los Angeles (USC) finished the 2015-16 rainfall year (July 1 to June 30) with 9.65 inches of recorded precipitation. This is about 65% of the 1981-2010 normal of 14.93 inches. This was the fifth consecutive year of below normal rainfall for Downtown Los Angeles, with a cumulative rainfall deficit of 35.86 inches --nearly three feet!

Observable impacts of the drought are widespread. Trees have been particularly hard hit. Dead trees can be seen along city streets, in parks, and throughout the open space areas and wildlands of Southern California. The dead and dying 100+ year old coast redwoods at Malibu Creek State Park are an example.

Most climate outlooks are forecasting La Nina conditions to develop over the Northern Hemisphere summer. Historically La Ninas have "on average" resulted in below normal precipitation in Southern California. But historical composites can be misleading. During the last five La Nina episodes (1999-00, 2000-01, 2007-08, 2010-11, 2011-12) Downtown Los Angeles (USC) has averaged 14.39 inches of rain, which is 96% of normal.

Even during one of three strongest El Ninos on record, precipitation outlooks based on historical composites and analogs didn't perform well in Southern California. Given the somewhat more variable rainfall in Southern California during La Ninas, to determine the winter precipitation outlook you might as well flip a three-sided coin.

More information about Southern California weather and climate can be found using our WEATHER LINKS page.

Saturday, July 2, 2016 1:39:23 PM (Pacific Daylight Time, UTC-07:00)  #    Disclaimer  |   | 
# Sunday, April 3, 2016

Following is a chart comparing the 2015-16 El Nino to warm ENSO episodes that have occurred since 1950. The warm episodes are based on the revised Oceanic Niño Index (ONI) which is calculated using the three month running mean of ERSST.v4 SST anomalies in the Niño 3.4 region with multiple-centered 30 year base periods. Unless noted the warm episodes are those specified in the CPC's tabulation of Cold & Warm Episodes by Season. A description of the parameters follows the chart. With the exception of years prior to 1957, a Nov-Mar GWO phase space plot is included for each warm episode.

Year Jul-Sep
AAM
Nov-Mar
AAM
Peak MEI Peak MEI Season Peak
ONI
Peak ONI Season L.A. Rain GWO
Phase Plot
1951-521 -- -- 0.822 JULAUG 0.9 SON 26.21 --
1952-532 -- -- 0.788 APRMAY 0.7 FMA-AMJ 9.46 --
1953-542 -- -- 0.484 AUGSEP 0.8 ASO, SON, OND 11.99 --
1957-583 -- 0.773 1.474 DECJAN, JANFEB 1.7 DJF 21.13 Click for Nov-Mar GWO Phase Space Plot
1958-59 -0.919 -0.206 0.788 JANFEB 0.6 NDJ, DJF, JFM 5.58 Click for Nov-Mar GWO Phase Space Plot
1963-64 0.005 0.046 0.867 OCTNOV, DECJAN 1.2 SON, OND 7.93 Click for Nov-Mar GWO Phase Space Plot
1965-66 -0.826 -0.748 1.436 JULAUG 1.8 OND 20.44 Click for Nov-Mar GWO Phase Space Plot
1968-69 0.130 0.513 0.844 JANFEB 1.0 JFM 27.47 Click for Nov-Mar GWO Phase Space Plot
1969-70 0.358 0.413 0.670 OCTNOV 0.8 ASO, SON, OND 7.77 Click for Nov-Mar GWO Phase Space Plot
1972-73 -0.096 -0.239 1.827 JUNJUL, JULAUG 2.0 OND 21.26 Click for Nov-Mar GWO Phase Space Plot
1976-77 0.284 -0.828 1.029 AUGSEP 0.8 OND,NDJ 12.31 Click for Nov-Mar GWO Phase Space Plot
1977-78 -0.646 1.008 0.993 SEPOCT, OCTNOV 0.8 OND, NDJ 33.44 Click for Nov-Mar GWO Phase Space Plot
1979-804 0.496 -0.013 0.996 NOVDEC 0.6 NDJ, DJF 26.98 Click for Nov-Mar GWO Phase Space Plot
1982-83 0.938 2.337 3.011 FEBMAR 2.1 OND,NDJ, DJF 31.25 Click for Nov-Mar GWO Phase Space Plot
1986-875 0.232 0.019 2.140 APRMAY87 1.2 JFM 7.66 Click for Nov-Mar GWO Phase Space Plot
1987-885 1.153 1.000 1.982 JULAUG 1.6 JAS, ASO 12.48 Click for Nov-Mar GWO Phase Space Plot
1991-92 -0.008 0.808 2.269 MARAPR 1.6 DJF 21.00 Click for Nov-Mar GWO Phase Space Plot
1994-95 -0.422 0.764 1.419 SEPOCT 1.0 NDJ 24.35 Click for Nov-Mar GWO Phase Space Plot
1997-98 1.811 1.481 3.049 JULAUG,AUGSEP 2.3 OND, NDJ 31.01 Click for Nov-Mar GWO Phase Space Plot
2002-03 0.047 0.324 1.199 DECJAN 1.3 OND 16.49 Click for Nov-Mar GWO Phase Space Plot
2004-05 -0.020 0.747 1.055 FEBMAR 0.7 JAS-NDJ 37.25 Click for Nov-Mar GWO Phase Space Plot
2006-07 0.143 -0.322 1.322 OCTNOV 1.0 NDJ 3.21 Click for Nov-Mar GWO Phase Space Plot
2009-10 -0.103 0.303 1.521 JANFEB 1.3 NDJ,DJF 16.36 Click for Nov-Mar GWO Phase Space Plot
2014-156 -0.526 -0.297 0.997, 1.567 MAYJUN14, APRMAY15 0.6 OND, NDJ 8.52 Click for Nov-Mar GWO Phase Space Plot
2015-167 1.313 1.637  2.527 AUGSEP 2.3 NDJ 9.36 Click for Nov-Mar GWO Phase Space Plot

1. AAM and AAM tendency anomaly data for 1951-52 not available.
2. Continuous warm episode from DJF 1952/53 to DJF 1954.
3. AAM anomaly is average for Jan-Mar 1958.
4. Warm episode per ERSST.v4, but not ERSST.v3b.
5. Continuous warm episode from ASO 1986 to JFM 1988.
6. Warm episode per ERSST.v3b, but not ERSST.v4.
7. Data as of April 3, 2016.

Jul-Sep AAM & Nov-Mar AAM: The mean of the global relative atmospheric angular momentum anomaly for the periods July 1 to September 30 amd November 1 to March 31 of the following year. GWO phase space data is calculated using code from the Global Synoptic Dynamic Model page of the PSD Map Room Climate Products. Reference Weickmann and Berry, 2008.

Peak MEI: The peak seasonal value of the Multivariate ENSO Index (MEI). Reference Wolter and Timlin, 1993, 1998. MEI values are normalized and may shift as new data is added.

Peak MEI Season: The peak bi-monthly season(s) for which the MEI is computed.

Peak ONI: The peak Oceanic Niño Index (ONI) based on SST anomalies in the Niño 3.4 region. Reference Climate Prediction Center Cold & Warm Episodes by Season (Multiple centered 30-year base periods.)

Peak ONI Season: The peak tri-monthly season(s) for which the ONI is computed.

L.A. Rain: The July-June rainfall year precipitation total in inches for Downtown Los Angeles (USC). Reference WRCC LOS ANGELES DWTN USC CAMPUS, CA.

GWO Phase Space Plot: Plot of global relative atmospheric angular momentum anomaly vs. global relative atmospheric angular momentum tendency anomaly for the period November 1 to March 31 of the following year. Data is calculated using code from the Global Synoptic Dynamic Model page of the PSD Map Room Climate Products. Reference Weickmann and Berry, 2008.

Sunday, April 3, 2016 8:46:40 AM (Pacific Daylight Time, UTC-07:00)  #    Disclaimer  |   |