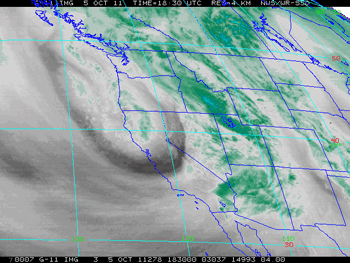

GOES-11 Water Vapor Image
Wednesday, October 5, 2011 - 11:30 am PDT
An unseasonably deep upper level low, unusually strong 170+ kt Pacific jet, and associated cold front combined to produce record-setting rainfall in Southern California Wednesday, October 5. Rainfall totals exceeded 1.0 inch in many areas.
Downtown Los Angeles (USC) recorded 1.15 inches, setting a new record for the date, and kick-starting the area's rainy season to 0.78 inch above normal. Rainfall records for the date were also set for LAX, Long Beach, Camarillo, Santa Barbara and several other locations. It was the first measurable rainfall at Los Angeles since June 17. Here are some preliminary precipitation totals from the NWS Los Angeles/Oxnard,NWS San Joaquin Valley/Hanford and NWS San Diego.
Enhanced convection in the Western Pacific associated with active phase of the MJO, and an extension of the North Pacific Jet caused by a positive East Asian mountain torque event appeared to have contributed to the unseasonable amount of rainfall. As observed by Ed Berry (Atmospheric Insights, Dec. 30, 2007), "...the MJO itself does not generate enough extratropical westerly wind flow to allow the East Asian jet to impact the USA west coast. A strong positive East Asian mountain torque needs to be involved, on average."
The increase in relative AAM shown by the GWO not withstanding, La Nina conditions appear to be consolidating in the equatorial Pacific. This four month sequence of Pacific Ocean Equatorial Temperature anomaly cross sections shows substantial subsurface cooling from July 11 to September 11. The Multivariate ENSO Index (MEI) has dropped from -0.5 for July/August to -0.8 for the August/September season. This drops the MEI from a rank of 16th last month to 13th this month, just above the quintile definition of a moderate La Niña ranking. Last year the MEI for August/September ranked 1st in the record since 1950. This TAO time-longitude plot of SST and SST anomaly shows less cooling than last year on this date.
To get an idea of what the impact of a second year La Nina might be on 2011-12 Winter precipitation in the continental U.S., the ESRL/PSD US Climate Division Dataset Mapping Page was used to construct a map of US composite precipitation anomalies for November to March for year two La Ninas since 1949. The years included were based primarily on MEI rankings, and include 1950-51, 1955-56, 1962-63, 1971-72, 1974-75, 1999-2000 and 2008-09. The base period was 1971-2000.
For this selection of years the coastal Southern California climate division recorded about 5 to 6 inches less precipitation than normal for the period November through March. The percent of normal water year rainfall recorded at Downtown Los Angeles (USC) ranged from a low of 47% (1971, 7.17"), to a high of 106% (1955, 16.00"). The average rainfall at Los Angeles for these years was 70.5% of normal, or 10.7".
More information about Southern California weather and climate can be found using our WEATHER LINKS page.