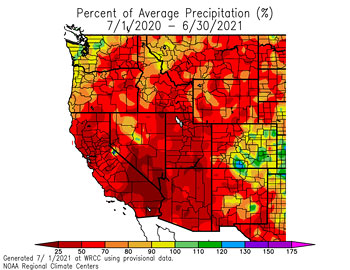

WRCC/HPRCC Percent of Normal Precipitation
July 1, 2020 to June 30 2021
Downtown Los Angeles (USC) ended the 2020-21 rain year (July 1 to June 30) with 5.82 inches of rain. This is about 41% of the new normal annual precipitation total of 14.25 inches. Much of the West recorded below average precipitation for the rain year.
The amount of rainfall that is considered "normal" for Downtown Los Angeles has decreased nearly an inch in the past three decades. The normal rainfall for Los Angeles was 15.14 inches based on 1971-2000 climate data, and dropped to 14.93 inches based on data from1981-2010. Analysis of 1991-2020 data provided the new normal of 14.25 inches. Interim 2006-2020 climate data is shockingly dry, with normal rainfall in Los Angeles calculated at only 11.39 inches! For more info see U.S. Climate Normals and Normals Calculation Methodology 2020 (PDF).
La Nina conditions developed in August 2020 and transitioned to ENSO-neutral in April 2021. The Oceanic Nino Index (ONI) decreased to a minimum of -1.3 in the Oct-Nov-Dec season. The EL NIÑO/SOUTHERN OSCILLATION (ENSO) DIAGNOSTIC DISCUSSION issued August 12, 2021 projects a 70% chance of La Nina conditions being present during November-January.
Los Angeles rainfall during La Ninas has been variable, but skewed to the drier side. The average rain year precipitation for the 24 ERSST.v5 ONI-based Cold Episodes since 1949 is 11.84 inches. The highest amount was 20.20 inches in 2010-11 and the lowest 4.68 inches in 2017-18. In the past decade, rainfall totals for Los Angeles have been less in the second year of successive cold episodes, but this pattern doesn't hold up over the entire record.
More information about Southern California weather and climate can be found using our WEATHER LINKS page.