Previous Page Page 3 of 6 in the climate category Next Page
# Saturday, 30 June 2012

TAO/TRITON Time-Longitude Plot SST and Anomaly Click
TAO/TRITON Time-Longitude Plot of SST and Anomaly
Saturday, June 30, 2012

Downtown Los Angeles (USC) will end the the 2011-2012 water year (July 1 to June 30) having recorded 8.69 inches of rain. This is about 58% of the 1981-2010 normal of 14.93 inches. The deficit of 6.24 inches is a little more than the 5-6 inch deficit recorded in a selection of similar second year La Nina years. According to data compiled by the NWS Santa Barbara will end the water year at about 66% of normal; Camarillo/Oxnard at 57%; Burbank Airport at 51%; LAX at 59%; and Long Beach Airport at 62%.

This TAO/Triton plot of Pacific equatorial SST and anomaly clearly depicts the evolution of our two year La Nina and the recent transition to warmer conditions. Is an El Nino in the works for this Winter? According to the Multivariate ENSO Index (MEI) a transition to El Nino conditions may already be underway. The April/May value of the MEI was +0.706. This is already within the range of a weak El Niño ranking. In his June 6 discussion of the MEI climatologist Klaus Wolter noted the last month's increase in the MEI was the 6th highest increase for this time of year since 1950. He also pointed out that it was the 4th monthly increase of this caliber in a row -- second only to the record of six consecutive large monthly increases in 1997 at the beginning of the mega El Nino of 1997-98. It will be very interesting to see if the string of large increases in the MEI continues with the May/June value.

While the ocean seems to be on board with the El Nino idea, the atmosphere appears to be balking -- at least for the moment. As of June 24, the AAM component of the GWO was down around -2.0, which is nearly as low as it's been during year two of the 2010-2012 La Nina. A positive value of AAM is generally associated with El Nino conditions.

More information about Southern California weather and climate can be found using our WEATHER LINKS page.

Saturday, 30 June 2012 16:27:44 (Pacific Daylight Time, UTC-07:00)  #    Disclaimer  |   | 
# Sunday, 26 February 2012

ESRL/PSD Analog 8-14 Day Probabilistic Precipitation Forecast Click
ESRL/PSD Analog 8-14 Day Probabilistic Precipitation Forecast
Probability of more than 25mm precipitation from 03/04/12 to 03/10/12.

Wednesday Downtown Los Angeles' water year rainfall total fell below 50% of normal for the date. With only 5.22 inches of rain in the bucket it looks like we're headed toward the driest rain season since the record-setting dry water year of 2006-2007, when a meager 3.21 inches was recorded. If Los Angeles ends the rain year (June 30) with less than 7.16 inches of precipitation, the 2011-2012 water year would be one of the ten driest on record.

It's been dry throughout most of Southern California and much of the state. According to data compiled by the NWS Burbank's water year total now stands at a paltry 34% of normal; Long Beach 49% of normal; Camarillo 42% of normal; Santa Barbara 56% of normal; and Paso Robles 49% of normal. Southernmost California has fared a little better with San Diego at about 79% of normal for the date. Central California rainfall is also well below average with San Francisco at 35% of the normal, San Jose at 26% and Sacramento at 40%.

I received an email recently from a reader asking if I thought a March Miracle was likely this year. Keeping in mind the chaotic nature of weather, and that low probability events do sometimes occur, the short answer is that I don't think it's likely we'll see higher than normal rainfall this March.

In a post in early October I discussed what the impact of a second year La Nina might be on 2011-12 Winter precipitation in the continental U.S. For a selection of seven second year La Ninas the coastal Southern California climate division recorded about 5 to 6 inches less precipitation than normal for the period November through March. If we take a look at March rainfall in that same selection of second year La Ninas, four of the seven recorded less than 0.5 inch rain in March, and only one was well above average -- 4.83 inches in March 1975.

Current outlooks are not favorable for higher than average March precipitation. The Climate Prediction Centers 6-10 Day Precipitation Outlook, 8-14 Day Precipitation Outlook, and One Month Precipitation Outlook all indicate below normal precipitation in Southern California. The ESRL/PSD Analog Probabilistic Precipitation Forecast is also dry in the 6-10 and 8-14 day outlook period, and the PSD Ensemble Spread does not look encouraging.

On the climate side of things the active phase of the MJO has been stalled in the Indian Ocean, but the 15-day ensemble ECMWF and several models forecast increased amplitude and eastward propagation. As a result of strong negative East Asian and Tropical torque events, relative atmospheric angular momentum is dropping like a rock, with the GWO taking a big dive into La Nina territory. Should the MJO continue to propagate and AAM increase over the next 2 weeks, perhaps we'll see the scenario necessary to generate an extended Pacific jet strong enough to impact the West Coast.

Monday its looking like we may get a little rain and possibly some lower elevation snow. Goes soundings and model data indicate the Pacific system is moisture-starved, but it is quite cold and is forecast to have strong dynamics. A GOES sounding near the systems core showed a 500mb temp of -30°C. Precipitable water values in the circulation around the low were around 0.6 inch. With such cold air aloft, and strong system dynamics, strong convection is a possibility. We'll see!

More information about Southern California weather and climate can be found using our WEATHER LINKS page.

Sunday, 26 February 2012 15:37:30 (Pacific Standard Time, UTC-08:00)  #    Disclaimer  |   | 
# Tuesday, 03 January 2012

Following is a chart comparing the 2011-12 La Nina to other cold ENSO episodes that have occurred since 1949. With the exception of 1961-62 and 2008-09 the cold episodes are based on the Oceanic Niño Index (ONI) and are those specified in the CPC's tabulation of Cold & Warm Episodes by Season. A description of the parameters follows the chart. A GWO phase space plot is included for those cold episodes for which AAM data is available. Data for 2011-12 will be updated periodically.

Year Nov-Mar
AAM
Peak MEI4 Peak MEI Season Peak
ONI
Peak ONI Season L.A. Rain GWO
Phase Plot
1949-501,2 -- -1.423 APRMAY -1.7 DJF 9.94 --
1950-511 -- -1.247 NOVDEC -1.0 NDJ, DJF 8.21 --
1954-551 -- -1.578 MAYJUN (54) -1.2 ASO 11.94 --
1955-561 -- -2.276 MAYJUN (55) -2.0 OND 16.00 --
1956-571 -- -1.516 MAYJUN (56) -0.9 SON, OND 9.54 --
1961-623 -0.513 -1.093 DECJAN -0.6 ASO, SON 18.79 Click for Nov-Mar GWO Phase Space Plot
1962-63 -1.259 -0.843 JANFEB -0.7 OND, NDJ 8.38 Click for Nov-Mar GWO Phase Space Plot
1964-65 -1.145 -1.496 JULAUG -1.2 SON, OND 13.69 Click for Nov-Mar GWO Phase Space Plot
1967-68 -0.770 -1.060 APRMAY -0.9 JFM 16.58 Click for Nov-Mar GWO Phase Space Plot
1970-71 -0.976 -1.898 MARAPR -1.3 DJF, JFM 12.32 Click for Nov-Mar GWO Phase Space Plot
1971-72 -0.173 -1.463 AUGSEP -1.0 OND 7.17 Click for Nov-Mar GWO Phase Space Plot
1973-74 -1.331 -1.942 DECJAN -2.1 NDJ 14.92 Click for Nov-Mar GWO Phase Space Plot
1974-75 -0.842 -1.255 OCTNOV -0.9 OND 14.35 Click for Nov-Mar GWO Phase Space Plot
1975-76 -0.713 -2.000 SEPOCT -1.7 OND, NDJ 7.22 Click for Nov-Mar GWO Phase Space Plot
1984-85 -0.597 -0.743 APRMAY -1.1 NDJ 12.82 Click for Nov-Mar GWO Phase Space Plot
1988-89 -1.139 -1.591 AUGSEP -1.9 OND, NDJ 8.08 Click for Nov-Mar GWO Phase Space Plot
1995-96 -0.227 -0.644 DECJAN -0.7 OND to JFM 12.46 Click for Nov-Mar GWO Phase Space Plot
1998-99 -0.541 -1.233 JANFEB -1.4 NDJ, DJF 9.09 Click for Nov-Mar GWO Phase Space Plot
1999-00 -0.781 -1.242 JANFEB -1.6 NDJ, DJF 11.57 Click for Nov-Mar GWO Phase Space Plot
2000-01 -0.795 -.755 OCTNOV -0.7 NDJ 17.94 Click for Nov-Mar GWO Phase Space Plot
2007-08 -1.010 -1.631 FEBMAR -1.4 DJF, JFM 13.53 Click for Nov-Mar GWO Phase Space Plot
2008-093 -0.596 -.783 SEPOCT -0.8 DJF 9.08 Click for Nov-Mar GWO Phase Space Plot
2010-11 -0.596 -2.037 AUGSEP -1.4 SON, OND, NDJ 20.20 Click for Nov-Mar GWO Phase Space Plot
2011-125 -0.370 -1.046 DECJAN -1.0 OND, NDJ 8.19 Click for Nov-Mar GWO Phase Space Plot
1. AAM and AAM tendency anomaly data not available.
2. Based on ONI values beginning with DJF 1949-50.
3. ONI did not meet threshold of 5 consecutive overlapping seasons.
4. MEI values are normalized and may change as new data is added. Specified values were current as of April 24, 2012.
5. Data as of April 24, 2012.

Nov-Mar AAM: The mean of the global relative atmospheric angular momentum anomaly for the period November 1 to March 31 of the following year. Data is from the GWO phase space data file linked on the Global Synoptic Dynamic Model page of the PSD Map Room Climate Products. Reference Weickmann and Berry, 2008.

Peak MEI: The peak seasonal value of the Multivariate ENSO Index (MEI). Reference Wolter and Timlin, 1993, 1998. MEI values are normalized and may change as new data is added.

Peak MEI Season: The peak bi-monthly season(s) for which the MEI is computed.

Peak ONI: The peak Oceanic Niño Index (ONI) based on SST anomalies in the Niño 3.4 region. Reference Climate Prediction Center Cold & Warm Episodes by Season.

Peak ONI Season: The peak tri-monthly season(s) for which the ONI is computed.

L.A. Rain: The water year precipitation total in inches for Downtown Los Angeles (USC). Reference NWS Los Angeles/Oxnard Downtown Los Angeles Climate Page, 1921-2006 Water Year Rainfall.

GWO Phase Space Plot: Plot of global relative atmospheric angular momentum anomaly vs. global relative atmospheric angular momentum tendency anomaly for the period November 1 to March 31 of the following year. Data is from the GWO phase space data file linked on the Global Synoptic Dynamic Model page of the PSD Map Room Climate Products. Reference Weickmann and Berry, 2008.

Tuesday, 03 January 2012 07:46:46 (Pacific Standard Time, UTC-08:00)  #    Disclaimer  |   | 
# Wednesday, 23 November 2011

Click
GOES-11 Water Vapor Image
Sunday, November 20, 2011 - 11:30 am PST

For the past two years Los Angeles has recorded above normal rainfall over the first six months of the water year (Jul. 1 to Dec. 31). So far this year is following suit.

After a record-setting storm in early October in which Downtown Los Angeles (USC) recorded over an inch or rain, a series of upper level troughs have continued to bump up the rainfall total. The systems have tended to be amplifying upper level troughs that split, typically transforming the southern half of the trough into a difficult-to-forecast cut-off upper level low. The resulting cut-off lows have then tracked over, along, or off the Southern California coast producing varying amounts of rain.

Sunday's system was the fourth to produce measurable rain in Los Angeles this November. A strong cold front produced very heavy rain, resulting in flooded streets and highways and resulting in a host of other weather-related problems. In the middle of it all runners in the PCTR Santa Monica Mountains 9K, 18K, 30K and 50K were running distances up to 31.5 miles on the trails of Pt. Mugu State Park.

Downtown Los Angeles (USC) recorded 0.90 inches for the storm, bringing the water year total to 2.75 inches. This is 1.11 inch above the new 1981-2010 normal for rainfall from July 1 through November 22. Here are some additional (preliminary) precipitation totals from around the area, compiled by the NWS Los Angeles/Oxnard. More than an inch above normal sounds like a lot, but as of today only guarantees Los Angeles precipitation will be above normal through December 12.

Back on July 1 NOAA released the new 1981-2010 climate normals, replacing the 1971-2000 normals that have been used this past decade. Normals serve as a 30 year baseline average of climate variables such as monthly and annual maximum, minimum, and mean temperature; and monthly and annual total precipitation. For example, Downtown Los Angeles' new normal annual precipitation total is now 14.93 inches, down from the 15.14 inches we've been using.

After dropping to -0.503 for July/August, and then to -0.772 for August/September, the September/October value of the Multivariate ENSO Index (MEI) has dropped a bit more to -.968 sigma. This is well within La Nina territory, but almost one sigma less than last year's September/October value. Plots of the Global Wind Oscillation (GWO) for July 1 to November 19, 2011 and the same period last year illustrate the year-to-year difference in the atmosphere's response to La Nina conditions. So far, this year's response is consistent with a more active MJO and a shift toward a more neutral ENSO state.

While there's still a chance of rain in Southern California Thanksgiving Day, the forecast is looking better than it did a few days ago when rain was considered likely. The difficulty in the forecast is yet another upper level trough splitting into a cut-off upper level low. The 12z NAM forecasts the low to remain offshore on Thanksgiving Day, and move into Northern Baja by the late afternoon. The 09z SREF puts the probability of more than 0.01 inch of rain in coastal Southern California for the 12 hours ending 4:00 pm Thursday at 10% - 30% and the chance of more than 0.10 inch of rain at around 10%. A shift in the track of the low toward the coast would significantly increase the chance of rain. We'll see!

More information about Southern California weather and climate can be found using our WEATHER LINKS page.

Wednesday, 23 November 2011 08:47:53 (Pacific Standard Time, UTC-08:00)  #    Disclaimer  |   | 
# Saturday, 08 October 2011

Click
GOES-11 Water Vapor Image
Wednesday, October 5, 2011 - 11:30 am PDT

An unseasonably deep upper level low, unusually strong 170+ kt Pacific jet, and associated cold front combined to produce record-setting rainfall in Southern California Wednesday, October 5. Rainfall totals exceeded 1.0 inch in many areas.

Downtown Los Angeles (USC) recorded 1.15 inches, setting a new record for the date, and kick-starting the area's rainy season to 0.78 inch above normal. Rainfall records for the date were also set for LAX, Long Beach, Camarillo, Santa Barbara and several other locations. It was the first measurable rainfall at Los Angeles since June 17. Here are some preliminary precipitation totals from the NWS Los Angeles/Oxnard,NWS San Joaquin Valley/Hanford and NWS San Diego.

Enhanced convection in the Western Pacific associated with active phase of the MJO, and an extension of the North Pacific Jet caused by a positive East Asian mountain torque event appeared to have contributed to the unseasonable amount of rainfall. As observed by Ed Berry (Atmospheric Insights, Dec. 30, 2007), "...the MJO itself does not generate enough extratropical westerly wind flow to allow the East Asian jet to impact the USA west coast. A strong positive East Asian mountain torque needs to be involved, on average."

The increase in relative AAM shown by the GWO not withstanding, La Nina conditions appear to be consolidating in the equatorial Pacific. This four month sequence of Pacific Ocean Equatorial Temperature anomaly cross sections shows substantial subsurface cooling from July 11 to September 11. The Multivariate ENSO Index (MEI) has dropped from -0.5 for July/August to -0.8 for the August/September season. This drops the MEI from a rank of 16th last month to 13th this month, just above the quintile definition of a moderate La Niña ranking. Last year the MEI for August/September ranked 1st in the record since 1950. This TAO time-longitude plot of SST and SST anomaly shows less cooling than last year on this date.

To get an idea of what the impact of a second year La Nina might be on 2011-12 Winter precipitation in the continental U.S., the ESRL/PSD US Climate Division Dataset Mapping Page was used to construct a map of US composite precipitation anomalies for November to March for year two La Ninas since 1949. The years included were based primarily on MEI rankings, and include 1950-51, 1955-56, 1962-63, 1971-72, 1974-75, 1999-2000 and 2008-09. The base period was 1971-2000.

For this selection of years the coastal Southern California climate division recorded about 5 to 6 inches less precipitation than normal for the period November through March. The percent of normal water year rainfall recorded at Downtown Los Angeles (USC) ranged from a low of 47% (1971, 7.17"), to a high of 106% (1955, 16.00"). The average rainfall at Los Angeles for these years was 70.5% of normal, or 10.7".

More information about Southern California weather and climate can be found using our WEATHER LINKS page.

Saturday, 08 October 2011 14:05:22 (Pacific Daylight Time, UTC-07:00)  #    Disclaimer  |   | 
# Monday, 12 September 2011

Click
GOES-11 Water Vapor Image
Saturday September 10, 2011 - 6:30 pm PDT

A dynamic cutoff upper low centered over Southern California produced numerous thunderstorms in Southern California and a broad area of the southwestern U.S. Saturday. The thunderstorms produced thousands of lightning strikes, some heavy downpours, hail and strong winds.

According to an article on Yuba.net over 15,000 lightning strikes were recorded in California over the 24 hour period ending 0600 PDT Sunday. This plot of lightning detections was produced by Tahoe National Forest. (Typically lightning detections include both cloud-cloud and cloud-ground strokes.)

Thunderstorms were widespread in Southern California and several strong thunderstorms were reported by the NWS. This NWS NEXRAD image from about noon on Saturday shows several strong cells including one area flagged as severe. This composite image from WSI/Intellicast.com at 2:45 pm PDT shows estimated cloud tops, cell movement and hail. Half inch hail was reported in several locations by NWS spotters and there was one report of 1.25 inch hail near Lake Los Angeles. A wide swath of enhanced thunderstorm activity developed in the afternoon to the north and northeast of Los Angeles.

Some of the higher rainfall totals reported by the NWS include Lake Palmdale at 0.98 inch; Palmdale 0.84 inch and Lockwood Valley 0.58 inch. Downtown Los Angeles recorded a trace. Here's a NWS Los Angeles/Oxnard tabulation of some rainfall totals from around the area. Here also is a NWS San Joaquin Valley/Hanford tabulation of some rainfall totals in the southern San Joaquin Valley and Sierra.

In a Southern California Weathernotes post in February I commented that the tough question regarding La Niña was whether warming would continue into the NH summer, with neutral ENSO conditions prevailing as we move into autumn; or if the ENSO cycle would swing back toward a La Nina state. It was noted that since 1949, about half of the first year La Nina episodes have continued into a second or third year.

Climate scientist and Multivariate ENSO Index (MEI) codeveloper Klaus Wolter first mentioned the roughly 50/50 chance that La Nina would return following a summer respite in September 2010. A glance at a plot of the extended MEI index, going back to 1871 clearly shows a propensity for a return of La Nina in the year (or years) following stronger La Nina episodes.

In a September 8, 2011 press release NOAA reported that La Nina is back. More precisely, in their September 8 ENSO Diagnostic Discussion CPC states "La Niña conditions have returned and are expected to gradually strengthen and continue into the Northern Hemisphere winter 2011-12." The Multivariate ENSO Index (MEI) has dropped below the weak La Nina threshold, and several oceanic and atmospheric factors are indicative of a reemerging La Nina. There's still a (historically) slight chance of a return to ENSO neutral conditions this fall, but it doesn't appear likely. We'll see!

More information about Southern California weather and climate can be found using our WEATHER LINKS page.

Monday, 12 September 2011 13:39:58 (Pacific Daylight Time, UTC-07:00)  #    Disclaimer  |   | 
# Thursday, 03 March 2011

Click
BUFKIT Bourgoiun Precipitation Type Analysis
For eWRF Ensembles for VNY at 8:00 am 02/26/11

The wetter ensemble member forecasts prevailed in last Friday's and Saturday's rain and snow event. Downtown Los Angeles recorded 1.20 inches for the storm. This brought the water year total to 15.78 inches, which is about 104% of normal. Although this might seem unusual in a La Nina influenced rain season, during two of the strongest La Ninas in the past 60 years -- 1955-56 and 1973-74 -- Los Angeles recorded 99% and 106% of normal rainfall. Here's an archived copy of a NWS tabulation of some rainfall totals from around the area from early Friday, February 25, to 10:00 p.m. Saturday, February 26.

The NAM and GFS, as well as the SREF and eWRF ensembles, had a tough time forecasting the rainfall produced by our current scenario -- a relatively shallow, moist westerly flow accompanied by modest jet stream dynamics. As this BUFKIT time-height cross section shows, the wettest eWRF ensemble member depicted a 125 kt jet max overhead, suggesting the models had some difficulty in forecasting the structure and strength of the jet. At best, the models forecast a few hundredths of an inch of rain in the Los Angeles area, but the most recent NWS tabulation of rainfall totals for the event lists many stations with between 0.1 and 0.25 inch. As of 4:00 a.m. this morning, Downtown Los Angeles has recorded 0.16 inches for the storm, bumping the water year total to 105% of normal.

As a result of the westerly flow, snow levels are currently high, but one of the interesting facets of last Friday's storm was the possibility of very low elevation snow. A NWS Winter Weather Advisory issued February 25 for the Santa Monica Mountains Recreation Area forecast the snow level to drop overnight from above 3000' to between 1000' and 1500'. Snow accumulations from 1 to 3 inches were expected. Some low elevation post frontal showers of graupel or snow were reported in the east San Fernando Valley and La Crescenta Saturday afternoon, but based on the conditions on Sandstone Peak (el. 3111'), the snow anticipated in the SMMRA did not occur. It was an especially challenging forecast, pitting pre-frontal warm air advection, against post-frontal cold air advection, falling humidity, and fluctuating regions of snow growth and omega.

Developed in part to help forecasters deal with lake effect snow, BUFKIT includes a number of special features for snow forecasting and visualization. For example, following are two time-height cross sections generated by BUFKIT from NAM data for VNY (Van Nuys) from 4:00 p.m. Friday, February 25. The elevation for the Bourgoiun precipitation type analysis for each cross section has been raised to 2711 feet MSL. The first BUFKIT cross section shows snow growth, omega, temperature, and the projected precipitation amount and type. The second cross section shows the same parameters, but with relative humidity instead of omega. The purple and yellow rectilinear contours are snow growth, and the red and blue contours are omega. The green bars are rain amounts, and the blue bars snow. Some of the things to note in these cross sections are the omega/snow growth "cross hair," freezing level, and rapid decrease in humidity with the frontal passage.

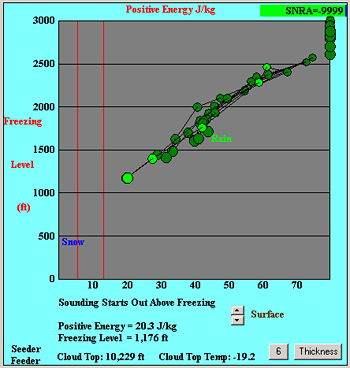
What the discrete NAM forecast can't show is the variability of the forecast situation. In its most recent release BUFKIT added support for SREF and eWRF ensembles. When combined with BUFKIT's precipitation type and other tools, ensemble forecasts can provide much additional information and insight. In this case eWRF ensemble members for VNY exhibited widely varying thermal profiles, regions of snow growth, omega, and humidity. BUFKIT's Bourgoiun precipitation type analysis for the eWRF ensemble members at 8:00 a.m. Saturday morning showed freezing levels as high as 2882' and as low as 1176'. The pattern of post-frontal precipitation was also quite variable.

More information concerning Southern California weather can be found using our WEATHER LINKS page.

Thursday, 03 March 2011 08:58:48 (Pacific Standard Time, UTC-08:00)  #    Disclaimer  |   | 
# Thursday, 17 February 2011

Click
HPC 3-Day Precipitation Forecast
For the Period Ending 4:00 a.m. Sunday Morning

The transition from a persistent West Coast ridge to a West Coast trough occurred on Monday more or less as forecast by medium range guidance back on February 5. A series of systems and impulses riding up and over a high amplitude Eastern Pacific ridge are expected to continue to produce cool, blustery weather in Southern California with periods of showers and rain into next week.

Precipitation on Valentine's Day was generally limited to areas north of the Los Angeles basin, but was a little more widespread late Monday night into Tuesday morning, with a number of stations in the Los Angeles area recording a few hundredths of an inch of rain.

Wednesday's system was much more energetic. Because of the convective nature of the precipitation, rainfall amounts were extremely variable, ranging 0.25 inch or less to 1.0 inch or more. Downtown Los Angeles (USC) recorded 0.65 inch of rain for the storm, bringing the water year total for Los Angeles to 13.14 inches. This is well above normal for the date, and about 87% of normal for the water year. Here's an archived copy of a NWS tabulation of some rainfall totals for the period 4:00 p.m. Tuesday to 4:00 a.m. Thursday.

Los Angeles only needs about 2 more inches of rain to top the 100% mark for the water year, and it looks like we could get most of that Friday and Saturday. BUFKIT analysis of 12z NAM data for Van Nuys indicates about 1.6 inches of rain Friday into Saturday, and then another 0.5 inch Saturday night. The HPC 3-day Quantitative Precipitation Forecast for the period ending 4:00 a.m. Sunday also indicates about 2.0 inches of rain in Southern California. This morning's 09z SREF puts the probability of more than 1.0 inch rain for the 24 hour period ending 1:00 p.m. Saturday at about 70%.

Temperature data at the surface and at depth in the equatorial Pacific suggest the La Nina is moderating. The tough question is whether warming will continue into the NH summer, with neutral ENSO conditions prevailing as we move into autumn; or if the ENSO cycle will swing back toward a La Nina state. Since 1949, about half of the first year La Nina episodes continued into a second or third year. At the moment the majority of computer models favor a transition to ENSO neutral or warm conditions by July 2011. Here is a compilation of ENSO Forecasts from the IRI ENSO Quick Look for February 17, 2011. We'll see!

More information concerning Southern California weather can be found using our WEATHER LINKS page.

Thursday, 17 February 2011 13:31:48 (Pacific Standard Time, UTC-08:00)  #    Disclaimer  |   | 
# Thursday, 20 January 2011

Click
Extended Pacific Jet and Resulting Mega-Ridge
GFS Forecast for Sunday Afternoon

Over the next two weeks, the MJO signal currently propagating across the western Pacific is forecast to destructively interfere with the La Nina base state, suppressing convection in the Indian Ocean and Indonesia and enhancing convection near the dateline. This is forecast to result in a transition from upper tropospheric anomalous cyclones to anticyclones near the dateline, and an extension of the East Asian/Pacific jet. These circulation changes may eventually lead to a retrogression of our persistent West Coast ridge, or perhaps a breakthrough of the westerlies underneath the highly amplified ridge.

The key word here is eventually. Over the next week or so, the extending Pacific jet is forecast to reamplify the ridge over the West Coast. But at some point, perhaps near the beginning of February, destructive interference in the Western Pacific will dwindle and convection in the Indian Ocean will strengthen. This should result in retraction of the Pacific jet, and possibly, a West Coast trough. The 240 hr forecast of the 12z ECMWF hinted at this possibility, as did the 18z GFS. We'll see!

After starting out cold and wet, the weather this January in Southern California, and much of the state, has been warm and dry. Monday, Pierce College in Woodland Hills hit a high of 88°F, and Downtown Los Angeles (USC) 84°F. So far this January, only 0.58 of rain has been recorded at Downtown Los Angeles (USC), which is a little less than one-third of normal for the month. However, because of our prodigious December rainfall the water year total at Los Angeles is currently 6.5 inches above the normal for the date of 5.78 inches.

Earlier this month I photographed these mid-level mammatus clouds over the western San Fernando Valley. They were produced by the moisture and dynamics associated with a closed upper level low that was about 390 miles WSW of Los Angeles. To see how the clouds evolved and more about the scenario at the time, see this post on PhotographyontheRun.com.

More information concerning Southern California weather can be found using our WEATHER LINKS page.

Thursday, 20 January 2011 19:25:42 (Pacific Standard Time, UTC-08:00)  #    Disclaimer  |   | 
# Sunday, 09 January 2011

Following is a chart comparing the 2010-11 La Nina to 22 other cold ENSO episodes that have occurred since 1949. With the exception of 1961-62 and 2008-09, the cold episodes are based on the Oceanic Niño Index (ONI) and are those specified in the CPC's tabulation of Cold & Warm Episodes by Season. A description of the parameters follows the chart. A GWO phase space plot is included for those cold episodes for which AAM data is available.

Year Nov-Mar
AAM
Peak MEI4 Peak MEI Season Peak
ONI
Peak ONI Season L.A. Rain GWO
Phase Plot
1949-501,2 -- -1.423 APRMAY -1.7 DJF 9.94 --
1950-511 -- -1.261 NOVDEC -1.0 NDJ, DJF 8.21 --
1954-551 -- -1.578 MAYJUN (54) -1.2 ASO 11.94 --
1955-561 -- -2.276 MAYJUN (55) -2.0 OND 16.00 --
1956-571 -- -1.516 MAYJUN (56) -0.9 SON, OND 9.54 --
1961-623 -0.511 -1.081 DECJAN -0.6 ASO, SON 18.79 Click for Nov-Mar GWO Phase Space Plot
1962-63 -1.254 -0.849 JANFEB -0.7 OND, NDJ 8.38 Click for Nov-Mar GWO Phase Space Plot
1964-65 -1.141 -1.496 JULAUG -1.2 SON, OND 13.69 Click for Nov-Mar GWO Phase Space Plot
1967-68 -0.767 -1.060 APRMAY -0.9 JFM 16.58 Click for Nov-Mar GWO Phase Space Plot
1970-71 -0.973 -1.898 MARAPR -1.3 DJF, JFM 12.32 Click for Nov-Mar GWO Phase Space Plot
1971-72 -0.172 -1.463 AUGSEP -1.0 OND 7.17 Click for Nov-Mar GWO Phase Space Plot
1973-74 -1.326 -1.937 DECJAN -2.1 NDJ 14.92 Click for Nov-Mar GWO Phase Space Plot
1974-75 -0.839 -1.256 OCTNOV -0.9 OND 14.35 Click for Nov-Mar GWO Phase Space Plot
1975-76 -0.711 -2.000 SEPOCT -1.7 OND, NDJ 7.22 Click for Nov-Mar GWO Phase Space Plot
1984-85 -0.595 -0.743 APRMAY -1.1 NDJ 12.82 Click for Nov-Mar GWO Phase Space Plot
1988-89 -1.135 -1.591 AUGSEP -1.9 OND, NDJ 8.08 Click for Nov-Mar GWO Phase Space Plot
1995-96 -0.226 -0.641 DECJAN -0.7 OND to JFM 12.46 Click for Nov-Mar GWO Phase Space Plot
1998-99 -0.539 -1.219 JANFEB -1.4 NDJ, DJF 9.09 Click for Nov-Mar GWO Phase Space Plot
1999-00 -0.778 -1.228 JANFEB -1.6 NDJ, DJF 11.57 Click for Nov-Mar GWO Phase Space Plot
2000-01 -0.795 -.747 OCTNOV -0.7 NDJ 17.94 Click for Nov-Mar GWO Phase Space Plot
2007-08 -1.007 -1.619 FEBMAR -1.4 DJF, JFM 13.53 Click for Nov-Mar GWO Phase Space Plot
2008-093 -0.594 -.783 SEPOCT -0.8 DJF 9.08 Click for Nov-Mar GWO Phase Space Plot
2010-11 -0.595 -2.037 AUGSEP -1.4 SON, OND, NDJ 20.20 Click for Nov-Mar GWO Phase Space Plot
1. AAM and AAM tendency anomaly data not available.
2. Based on ONI values beginning with DJF 1949-50.
3. ONI did not meet threshold of 5 consecutive overlapping seasons.
4. MEI values are normalized and may change as new data is added. Specified values were current as of November 8, 2011.

Nov-Mar AAM: The mean of the global relative atmospheric angular momentum anomaly for the period November 1 to March 31 of the following year. Data is from the GWO phase space data file linked on the Global Synoptic Dynamic Model page of the PSD Map Room Climate Products. Reference Weickmann and Berry, 2008.

Peak MEI: The peak seasonal value of the Multivariate ENSO Index (MEI). Reference Wolter and Timlin, 1993, 1998. MEI values are normalized and may change as new data is added.

Peak MEI Season: The peak bi-monthly season(s) for which the MEI is computed.

Peak ONI: The peak Oceanic Niño Index (ONI) based on SST anomalies in the Niño 3.4 region. Reference Climate Prediction Center Cold & Warm Episodes by Season.

Peak ONI Season: The peak tri-monthly season(s) for which the ONI is computed.

L.A. Rain: The water year precipitation total in inches for Downtown Los Angeles (USC). Reference NWS Los Angeles/Oxnard Downtown Los Angeles Climate Page, 1921-2006 Calendar Year Rainfall.

GWO Phase Space Plot: Plot of global relative atmospheric angular momentum anomaly vs. global relative atmospheric angular momentum tendency anomaly for the period November 1 to March 31 of the following year. Data is from the GWO phase space data file linked on the Global Synoptic Dynamic Model page of the PSD Map Room Climate Products. Reference Weickmann and Berry, 2008.

Sunday, 09 January 2011 15:02:14 (Pacific Standard Time, UTC-08:00)  #    Disclaimer  |   | 
# Friday, 17 December 2010

HPC 5-Day Precipitation Forecast For the 5 Day Period Ending December 22, 2010 at 4:00 a.m. Click
HPC 5-Day Precipitation Forecast
For the 5 Day Period Ending December 22, 2010 at 4:00 a.m.

If current precipitation forecasts and outlooks validate, December 2010 could become one of the wettest on record in California, and at the higher elevations of the Sierra, one of the most snowy. This morning's 5-day precipitation forecast from the Hydrometeorological Prediction Center, for the 5-day period ending early Wednesday morning, indicates up to 7.9 inches of precipitation locally, and 14.7 inches (water equivalent) in the Sierra. And additional precipitation is forecast beyond the 5 day period.

A large Pacific low working in concert with a low west of Hawaii has established a tropical connection, and is pumping copious amounts of moisture into California. This tropical moisture conveyor belt scenario is currently forecast to continue into next week. Late Sunday, shortwave impulses dig down into the low and elongate it southwestward, creating a large longwave trough. This northern part of this trough is forecast to evolve into another large upper and surface low in the northeastern Pacific. The southern part of the trough is forecast to develop a surface low and front that moves into Southern California Tuesday into Wednesday.

In the short term, BUFKIT analysis of WRF ensemble data for Van Nuys shows precipitation totals through early Sunday morning ranging from about 1.0 inch up to about 3.5 inches. Analysis of 12z NAM data for Van Nuys produces around 1.8 inches through early Sunday morning and nearly 5 inches through early Monday morning. The 09z SREF pegs the probability of more than 1.0 inch of precipitation in Los Angeles area at around 70%. Precipitable water values of over 1.0 inch, high relative humidity, and a strong south to southwesterly inflow of over 30 knots should produce significantly enhanced precipitation on favored slopes -- generally those with a south to southwest aspect.

It's a little early to put much credence in forecasts for next week, other than more rain appears likely. The 06z GFS produced astronomic precipitation totals mid-week -- several inches more than either yesterday afternoon's 00z run (2.75 inches), or this morning's 12z run (4.6 inches). We'll see!

As of yesterday Downtown Los Angeles (USC) rainfall was 0.91 inch below normal for the water year, and much of Southern California was falling behind in the rainfall department. It looks like by next week we'll be ahead of the La Nina game again, perhaps way ahead.

More information concerning Southern California weather can be found using our WEATHER LINKS page.

Friday, 17 December 2010 10:48:15 (Pacific Standard Time, UTC-08:00)  #    Disclaimer  |   | 
# Tuesday, 09 November 2010

AHPS Precipitation (Percent of Normal) for 30 Days Ending November 1. Click
AHPS Precipitation (Percent of Normal)
For 30 Days Ending November 1, 2010.

October was an unusually wet month in coastal Southern California. Many areas recorded more than an inch above normal rainfall, and some as much as 3 inches above normal. In a month where around 0.5 inch is considered normal, some areas received several times the normal amount of rainfall.

Most of October's rain resulted from two energetic upper lows, and a relatively strong trough/front that swept through the area October 30th. The front produced a new precipitation record for the date of 1.09 inches at Santa Barbara Airport Here's an archived NWS Public Information Statement with some rainfall totals for that storm.

Last week, an approaching Pacific trough pumped up a thick high pressure ridge over California, sending temperatures soaring and breaking temperature records across the area. November 3rd Long Beach Airport set a new high temperature record for the date of 100°F, and Downtown Los Angeles set a new record of 97°F. November 4th temps were once again in high 90s and several stations broke or tied high temperature records. Here are archived copies of the NWS Record Event reports for November 3 and November 4.

The southern part of the Pacific trough that produced our record high temps cut-off into a small upper low as it approached the coast, and moved onshore north of the Los Angeles basin on Saturday. The remainder of the trough and its associated front moved through the area Sunday evening into Monday. The front held together a little better than expected, and rainfall totals in the Los Angeles basin and valleys generally ranged from about 0.10 inch to 0.30 inch. Here's an archived NWS Public Information Statement with some rainfall totals from around the area..

The latest round of rainfall leaves many areas of Southern California way ahead on rainfall totals for the water year. Downtown Los Angeles (USC) missed out on a couple of the systems, and as of close of business yesterday has recorded 1.10 inch for the water year, which is only 0.06 inch above normal. By comparison, Los Angeles Airport is 0.85 inch above normal, and Camarillo/Oxnard is 0.97 inch above normal. This headstart on the rain season should help keep our rainfall totals a little closer to normal as our La Nina influenced rain season continues.

Speaking of La Nina, the September/October value of the Multivariate ENSO Index (MEI) increased slightly by 0.079 sigma, ending the record plunge from El Nino conditions earlier this year. In the past 30 days there was some decrease in the magnitude of negative SST anomalies in the east-central equatorial Pacific, but subsurface temperatures remain quite cool. Computer models are split on whether Nino 3.4 SST anomalies will continue to decline in magnitude during the Northern Hemisphere winter, but nearly all models indicate decreasing anomalies in early 2011. We'll see!

More information concerning Southern California weather can be found using our WEATHER LINKS page.

Tuesday, 09 November 2010 10:21:12 (Pacific Standard Time, UTC-08:00)  #    Disclaimer  |   |