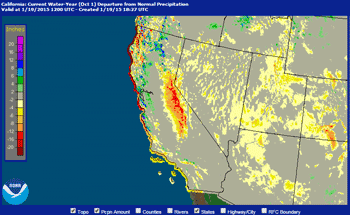

Current Departure from Normal Precipitation Since October 1
AHPS Precpitation Analysis as of 1/19/2015 12:00 UTC.
After being negative for 3 1/2 years, the PDO Index has been positive since January 2014. December's PDO value of 2.51 is the highest for that month on record (since 1900), exceeding December 2002's value of 2.10 and December 1940's value of 1.96.
Even so, the highly anticipated 2014-15 El Nino continues to dawdle with little ocean-atmosphere coupling and an emphasis on an higher amplitude meridional flows. Due in part to the upwelling phase of a series of oceanic Kelvin waves, equatorial Pacific heat content and SST anomalies have diminished. After having been at or above 0.5 °C for the past twelve weeks OISST.v2 Nino 3.4 SST Anomalies dropped to 0.4 °C for the week centered on January 7, 2015 and as of the week of January 14 was at 0.5 °C.
The Multivariate ENSO Index (MEI) for NOV/DEC has decreased 0.13 SD to +0.58, but has maintained its historic rank (since 1950) at 47. A rank of 46 is the threshold for weak El Nino conditions in the context of the MEI. The FNL Global Wind Oscillation for the past 90 days continues to reflect the lack of definitive atmospheric coupling.
So far this rain season Northern California and the coastal areas of Central and Southern California have fared much better in terms of precipitation than last year. As of today Downtown Los Angeles (USC) precipitation for the water year (beginning July 1) is at 90% of normal and Downtown San Francisco is at 127%.
As this AHPS plot of precipitation since October 1 shows, many areas of California have recorded at least 75% of normal precipitation. Unfortunately the Sierra Nevada is not one of them. While better than last year's dismal 14% of normal on this date, this year's snowpack is currently well below average, and was last reported at 36%. Here is an AHPS plot of precipitation departure since October 1 that shows the deficits in the Sierra Nevada.
At the moment it doesn't look like the snowpack will get much help in the short term. After fending off a little shortwave the blocking ridge is forecast to rebuild to new heights, bringing unseasonably mild weather to much of the West Coast. There does appear to be the possibility of a wildcard low latitude low developing under the block and that could result in some precipitation in Southern California next week. If such a system develops, given the warm state of the Eastern Pacific, it could be wetter than expected. We'll see!
In the early morning hours of Friday, December 12, 2014, a very strong cold front, enhanced with moisture from an atmospheric river, produced a line of strong storms that produced rain rates in the Springs Fire burn area as high as 2 inches per hour. This resulted in widespread flash floods and debris flows in the burn area, much of which is in Pt. Mugu State Park. Mud and debris flows originating from the burn area inundated homes below Conejo Mountain and closed Pacific Coast Highway. This slideshow includes photos of the aftermath of the flash floods and debris flows in Blue Canyon, Sycamore Canyon and Upper Sycamore. The photos were taken on a trail run on December 14, 2014. Also included are some NWS Los Angeles/Oxnard tweets and some additional meteorological images and info.
More information about Southern California weather and climate can be found using our WEATHER LINKS page.