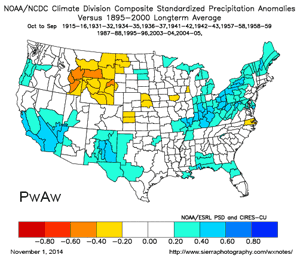

Warm Pacific/Warm Atlantic Composite Precipitation Anomaly
Based on JUL-SEP PDO Index and AMO Index.
The "PDO minus AMO" composite precipitation anomaly maps prepared by Dr. Klaus Wolter of CIRES as part of an experimental seasonal forecast for the California DWR last year were consistent with the below average precipitation observed in California in the water years Oct 2012 - Sep 2013 and Oct 2013 - Sep 2014.
As referenced in Dr. Wolter's 2013 DWR presentation, Schubert et al. (J. Climate, 2009) found that five global climate models produced the least precipitation in the continental U.S. when the Pacific is cold (Pc) and the Atlantic warm (Aw). Conversely four of the five models produced the wettest conditions when the Pacific is warm (Pw) and Atlantic cold (Ac). As shown in this figure, all combinations with the Pacific cold (PcAw, PcAn, PcAc) produced below average precipitation and all combinations with the Pacific warm (PwAw, PwAn, PwAc) produced above average precipitation.
While the development of the 2014 El Nino has waxed and waned over the past several months, there has been a definitive change that might significantly impact the weather in California and the U.S. -- the Pacific has warmed. For five of the past six years the JUL-SEP PDO has been negative. This year the PDO has been positive since January.
To get an idea of how the change to a warm Pacific might affect precipitation in the U.S. the PDO index and AMO index values for JUL-SEP for the past 115 years were ranked and then divided into tercile classes, producing nine PDO/AMO states.
The NOAA/NCDC Climate Division Mapping and Analysis Web Tool was then used to generate composite precipitation maps for October to September and December to January for the six combinations of Pacific warm and Pacific cold states: PwAw, PwAn, PwAc and PcAw, PcAn, PcAc.
The PwAw composites show much more precipitation in Southern California and the Southwestern U.S. than the PcAw composites. It might be argued that it is the El Nino years in the PwAw composites that produce the wet signal in Southern California. However, if the El Nino years are removed from the PwAw composites for Oct-Sep and composites for Dec-Feb, a wet signal persists.
Of course there are many factors that can influence the amount of precipitation in a particular locale in a particular season or water year. Composites are not forecasts any more than monthly climate normals are forecasts; but both can provide useful guidance. In the PwAw case 7 of the 12 selected years in the composite were wet in Southern California and two-thirds of the years had near normal or above average precipitation. We'll see what happens in 2014-2015.
More information about Southern California weather and climate can be found using our WEATHER LINKS page.