
WRCC/HPRCC Percent of Normal Precipitation
July 1, 2018 to June 30 2019
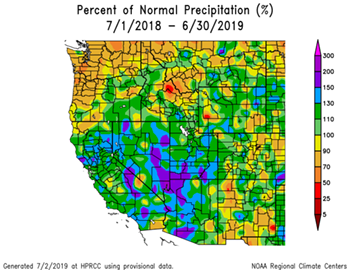
Downtown Los Angeles (USC) ended the 2018-19 rain year (July 1 to June 30) with 18.82 inches of rain. This is about 126% of the normal yearly precipitation total of 14.93 inches. Much of the southwest recorded average to above average precipitation, thanks to a generally progressive pattern in the West and a strong Pacific jet this Winter.
Based on the CPC's Oceanic Nino Index (ONI), equatorial Pacific SSTs capable of supporting El Nino conditions developed in the Sep-Oct-Nov 2108 season, but ocean-atmosphere coupling characteristic of El Nino did not develop until January 2019.
Although this year's El Nino was weak and somewhat atypical, it should be noted that the Global Wind Oscillation orbited through positive AAM phases from mid October until just recently. Historically, continually positive AAM anomaly values during the Nov-Mar period have occurred during strong El Ninos, such as in 1997-98 and 1982-83. The Nov-Dec GWO Phase Plots for ONI-based warm episodes can be found on our El Nino Comparison Chart for 2018-2019 page.
There is some evidence that suggests Southern California precipitation is more closely correlated with AAM than with Nino 3.4 SST.
More information about Southern California weather and climate can be found using our WEATHER LINKS page.