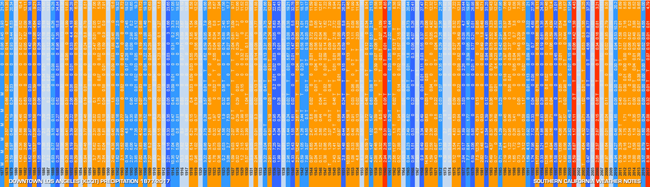
Color-coded Los Angeles (KCQT) Precipitation
July 1877 to June 2018
The graphic above is color-coded chart of Los Angeles (KCQT) rain year precipitation from 1877 to 2017, a period of 141 years. Years progress from left to right. The rain year is from July 1 of the indicated year to June 30 of the following year. Colors are indicative of the following amounts of rain:
Red: VERY DRY - less than 5 inches of rain.
Orange: DRY - more than 5 inches of rain, but less than 13 inches.
Light blue: ABOUT AVERAGE - more than 13 inches of rain, but less than 17 inches.
Blue: WET - more than 17 inches of rain, but less than 22 inches.
Dark Blue: VERY WET - more than 22 inches of rain.
Following are some observations regarding Los Angeles rainfall:
- VERY DRY and DRY years (orange & red) have been more common than VERY WET and WET years (blue & dark blue). In the first 70 years there were a few more dry years than wet years (30 vs. 25). In the last 70 years there have been about twice as many dry years as wet years (41 vs 20).
- Extended dry periods (orange & red) have been more common than extended wet periods (blue & dark blue) and generally last longer. The longest uninterrupted dry period is 7 years, while the longest wet period is only 3 years. If we allow for one interceding year, the longest dry period is 11 years and the longest wet period is 5 years.
- There were no VERY DRY years (red) prior to 1960 and three of the four VERY DRY years have occurred since 2001.
- ABOUT AVERAGE years (light blue) have not been common. Only 24 of 141 years (17%) have had ABOUT AVERAGE rainfall. The first 70 years had 15 ABOUT AVERAGE years and the last 70 years had 9 ABOUT AVERAGE years.
- Overall, VERY WET years (dark blue) have been more common than VERY DRY years (red), but in the last 30 years the number of VERY WET years (4) and VERY DRY years (3) have been about equal.
- Consecutive VERY WET (dark blue) or VERY DRY years (red) have been rare. There has been one instance of back-to-back VERY WET years (1956 & 1957) and no instances of back-to-back VERY DRY years.
Here is a PDF of the rainfall chart. The chart includes the January - December precipitation amounts for each year, as well as the rain year value.
More information about Southern California weather and climate can be found using our WEATHER LINKS page.