NOTES ABOUT SOUTHERN CALIFORNIA WEATHER & CLIMATE
© 2000-2024 Gary Valle'. All Rights Reserved.
|
NOTES ABOUT SOUTHERN CALIFORNIA WEATHER & CLIMATE © 2000-2024 Gary Valle'. All Rights Reserved. |
IMPORTANT!! The
information presented on this web site may include errors of transcription,
interpretation, and other errors. The information may be out of date or
inaccurate. Please refer to the NATIONAL WEATHER SERVICE FORECAST OFFICE
LOS ANGELES or your local weather service office for official
forecasts and warnings. |
|
Southern California El Niño
Impacts and the Global Wind Oscillation. Following several weeks of dry weather, a shift to a wetter pattern brought much needed rain and snow to California this past week. The pattern change was apparently induced by MJO enhancement of El Niño convection in the equatorial Pacific. |
||||||||||||
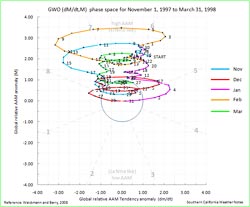
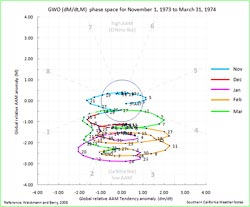
Downtown Los Angeles recorded 1.78 inches of rain from Thursday to Sunday, bringing the water year total to 4.81 inches. This is about 2.20 inches above normal for the date. Rainfall totals generally ranged from 2 to 4 inches in the basin and valleys, and 2 to 6 inches in the mountains. Here's an archived copy of a NWS Public Information Statement with rainfall totals from around the area. Will the current El Niño produce the expected seasonal impacts in Southern California? A new tool that can help gain some insight into the linkage of climate and weather is the Global Wind Oscillation (GWO) phase space plot. Ed Berry repeatedly demonstrated the usefulness of this tool in his blog Atmospheric Insights. Although the blog has been discontinued, its content remains a valuable resource. The GWO is a recurring subseasonal phenomenon that involves the transport and interchange of momentum in the earth-atmosphere system. It encompasses the MJO and occurs on a similar timescale. Analogous to the MJO phase space plot, but based on a framework of atmospheric angular momentum (AAM), the GWO phase space plot is a measure global relative atmospheric angular momentum and it's tendency. For details, see Weickmann & Berry, 2008. Relative AAM is generally positive during an El Niño and negative during a La Nina. Relative AAM is correlated with rain season precipitation in Southern California*, and can be helpful in assessing potential El Niño impacts. The following November to March GWO phase plots show the distinctly different behavior of the GWO during the strong El Niño of 1997-98, and the strong La Nina of 1973-74:
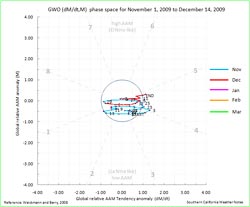
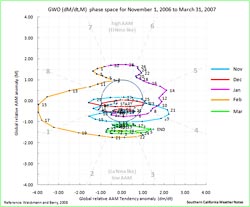
In a decade characterized by quirky El Niños, the El Niño of 2009-10 has been acting like another odd one. From a Southern California perspective, the concern has been that it might be like the El Niño of 2006-07 when Downtown Los Angeles recorded only 3.21" of rain over the water year. In the early stages of the El Niño of 2006 strong convection developed in the Indian Ocean during November, but an MJO did not develop until a second round of Indian Ocean convection occurred in mid December. Relative AAM remained negative, and in terms of the atmosphere, the 2006 El Niño didn't make it to 2007. This year, Indian Ocean convection did spawn an MJO which eventually enhanced El Niño convection near the dateline. Significant momentum was added to the mid-latitudes of the Northern Hemisphere, energizing the westerlies and contributing to the pattern change that resulted in our recent wet weather. However, the increase in mid-latitude AAM has been mostly offset by negative anomalies at higher latitudes. Following are the GWO phase space plots for the current rain season to date, and the quirky El Niño of 2006-07.
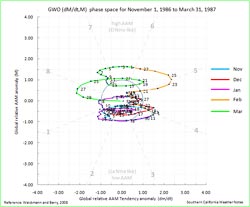
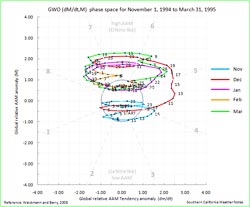
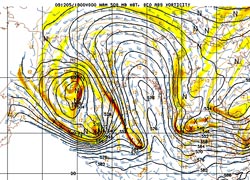
So where do we go from here?. For at least a few days the storm track has shifted north. It appears the GWO might be starting an orbit that will take it farther into the El Niño side of the phase space. Several MJO forecasts show the next MJO cycle shortcutting it's orbit back into the Western Pacific. In the 6-10 day period, the GEFS ensemble MJO forecast indicates enhancement of equatorial convection around 90E, and suppression (by the MJO contribution) of El Niño convection near the dateline. This could modify any short term response of the El Niño signal and the GWO, once again reducing AAM. Below are the GWO phase plots for two El Niños with ONI and MEI values comparable to the current El Niño. In the 1986-87 El Niño, November to March AAM averaged 0.02, and it wasn't until February that the GWO climbed out of the AAM doldrums. That water year Los Angeles recorded 7.66 inches of rain. On the other hand, in the 1994-95 El Niño, November to March AAM averaged 0.76. In mid December the GWO began to reflect an ocean-atmosphere coupled El Niño response, and Los Angeles went on to record 24.35 inches of rain for the water year. At the moment it looks like Southern California might not be as dry as 1986-87, but probably not as wet as 1994-95. We'll see!
*1958-2008 Precipitation/AAM correlation plot generated using US Climate Division Dataset Seasonal Correlation Page. More information concerning Southern
California weather can be found using our WEATHER
LINKS page. |
|||||||||||||
|
MJO Stirs Up Pattern Change. Induced by MJO enhanced convection in the West Pacific, a change in pattern is underway which is expected to produce significant rainfall in California over the next week. |
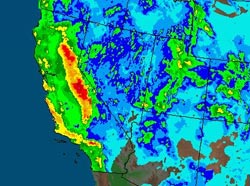
The first shortwave is forecast to ride down the east side of a very high amplitude blocking ridge along the West Coast, dig offshore on Sunday evening, and merge with another shortwave as the westerlies try to undercut the ridge on Monday. It's an extraordinarily complex scenario, and just how it will play out is hard to say. A BUFKIT analysis of 18z NAM data generates about 1.2" at LAX and about 1.5" at VNY. Relatively strong south to southwest inflow is forecast and would be expected to produce higher precipitation amounts in favored foothill and mountain locations. Mid-week the westerlies are forecast to break through underneath the ridge, opening the door to more wet weather. Update 12/08/09 5:00 p.m. The best dynamics worked out to be south and east of Los Angeles county, and as this AHPS graphic shows that's where the most precipitation was recorded. But the Los Angeles area still received it's fair share of precipitation and managed to do so without inundating the areas burned in the San Gabriel Mountains by the Station Fire. This was due in part to the generally moderate rainfall rates and the low snow level. This Intellicast.com composite radar image from 2:30 Monday afternoon shows the jet enhanced precipitation to the south of the Los Angeles basin, and the frontal band north of the basin. Over the course of the storm Downtown Los Angeles (USC) recorded 0.95 inches, bringing the water year total to 2.28 inches, which is about 0.75 inches above normal for the date. Here's an archived copy of a NWS Public Information Statement with rainfall -- and snowfall -- totals from around the area. More information concerning Southern
California weather can be found using our WEATHER
LINKS page. |
|